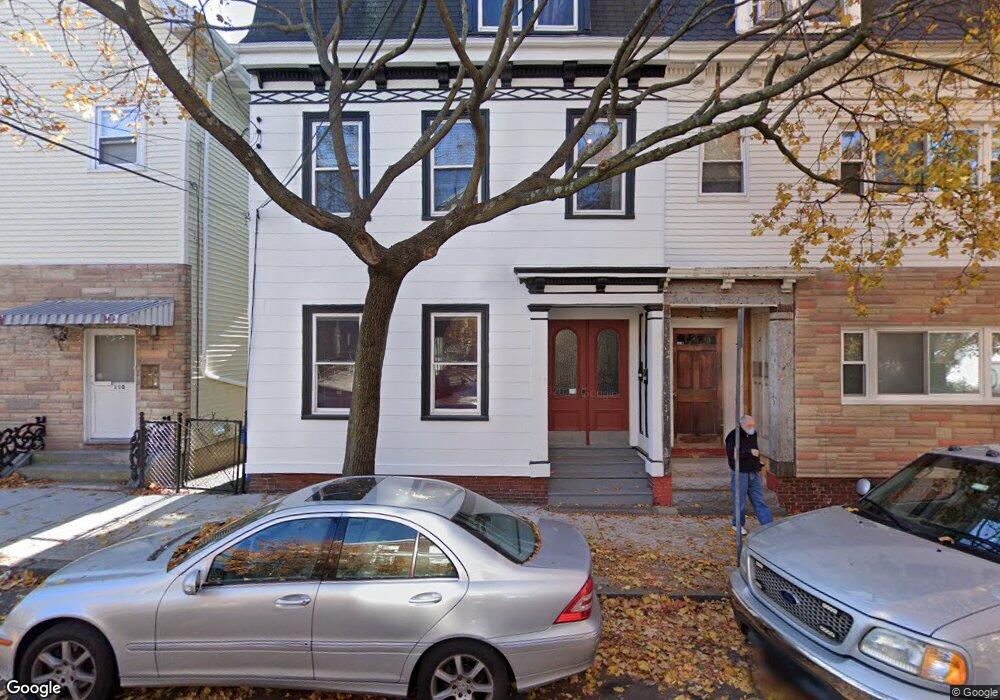
112 Thorndike St Cambridge, MA 02141
East Cambridge NeighborhoodEstimated Value: $1,630,000 - $2,268,000
4
Beds
4
Baths
2,905
Sq Ft
$645/Sq Ft
Est. Value
About This Home
This home is located at 112 Thorndike St, Cambridge, MA 02141 and is currently estimated at $1,873,667, approximately $644 per square foot. 112 Thorndike St is a home located in Middlesex County with nearby schools including Community Charter School of Cambridge and Torit Montessori School.
Ownership History
Date
Name
Owned For
Owner Type
Purchase Details
Closed on
Mar 25, 2014
Sold by
Otash James A
Bought by
Tobey Nt
Current Estimated Value
Purchase Details
Closed on
Mar 16, 1989
Sold by
Otash James A
Bought by
Nash Eileen
Home Financials for this Owner
Home Financials are based on the most recent Mortgage that was taken out on this home.
Original Mortgage
$101,250
Interest Rate
10.46%
Mortgage Type
Purchase Money Mortgage
Create a Home Valuation Report for This Property
The Home Valuation Report is an in-depth analysis detailing your home's value as well as a comparison with similar homes in the area
Home Values in the Area
Average Home Value in this Area
Purchase History
| Date | Buyer | Sale Price | Title Company |
|---|---|---|---|
| Tobey Nt | -- | -- | |
| Nash Eileen | $112,500 | -- |
Source: Public Records
Mortgage History
| Date | Status | Borrower | Loan Amount |
|---|---|---|---|
| Previous Owner | Nash Eileen | $101,250 |
Source: Public Records
Tax History
| Year | Tax Paid | Tax Assessment Tax Assessment Total Assessment is a certain percentage of the fair market value that is determined by local assessors to be the total taxable value of land and additions on the property. | Land | Improvement |
|---|---|---|---|---|
| 2025 | $8,181 | $1,288,300 | $535,500 | $752,800 |
| 2024 | $7,723 | $1,304,500 | $579,400 | $725,100 |
| 2023 | $6,990 | $1,192,900 | $539,800 | $653,100 |
| 2022 | $6,813 | $1,150,900 | $560,800 | $590,100 |
| 2021 | $6,472 | $1,106,300 | $538,500 | $567,800 |
| 2020 | $6,263 | $1,089,300 | $542,400 | $546,900 |
| 2019 | $6,219 | $1,046,900 | $532,100 | $514,800 |
| 2018 | $5,601 | $890,500 | $441,200 | $449,300 |
| 2017 | $5,477 | $843,900 | $394,500 | $449,400 |
| 2016 | $5,054 | $723,000 | $308,900 | $414,100 |
| 2015 | $4,884 | $624,600 | $264,700 | $359,900 |
| 2014 | $4,480 | $534,600 | $205,100 | $329,500 |
Source: Public Records
Map
Nearby Homes
- 104 Thorndike St Unit 2
- 76-78 Thorndike St
- 259 Hurley St Unit 4
- 241 Hurley St Unit 1
- 78 Otis St
- 303 Hurley St
- 66 6th St Unit 3
- 66 6th St Unit 2
- 93 Third St
- 101 Third St Unit 2
- 50 Spring St
- 59 7th St
- 59 7th St Unit 2
- 59 7th St Unit 1
- 59 7th St Unit 3
- 3 Mullins Ct Unit 3
- 57 Hurley St Unit 3
- 95 2nd St Unit 3
- 47-53R 8th St
- 30
- 112 Thorndike St Unit 2
- 112 Thorndike St
- 112 Thorndike St Unit 1
- 112 Thorndike St Unit 3
- 110 Thorndike St
- 110 Thorndike St Unit 1F
- 110 Thorndike St
- 110 Thorndike St Unit 1R
- 114 Thorndike St
- 114 Thorndike St
- 114 Thorndike St Unit 1
- 116 Thorndike St
- 106-108 5th St Unit 1
- 106 5th St Unit 108
- 106 5th St Unit 108
- 106 5th St Unit 108
- 106 5th St Unit 3
- 106 5th St
- 106 Thorndike St
- 118 Thorndike St
Your Personal Tour Guide
Ask me questions while you tour the home.