Estimated Value: $190,000 - $207,078
3
Beds
2
Baths
2,541
Sq Ft
$78/Sq Ft
Est. Value
About This Home
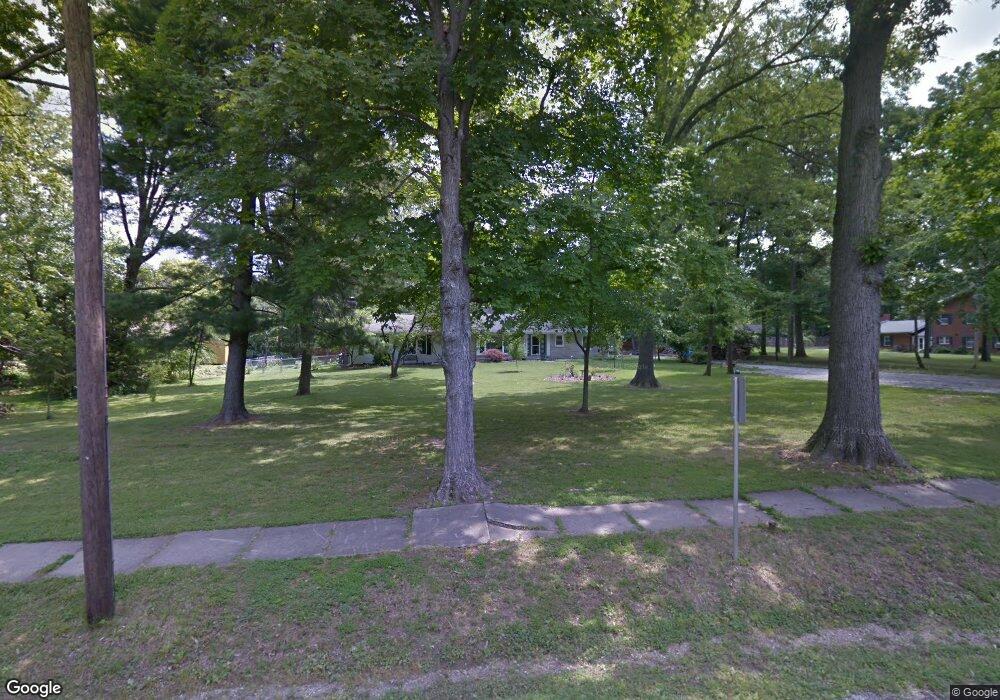
This home is located at 1120 S Morgan St, Olney, IL 62450 and is currently estimated at $198,520, approximately $78 per square foot. 1120 S Morgan St is a home located in Richland County with nearby schools including Richland County Elementary School, Richland County Middle School, and Richland County High School.
Ownership History
Date
Name
Owned For
Owner Type
Purchase Details
Closed on
Oct 15, 2009
Sold by
Williams Robert E and Williams Judy M
Bought by
Hagen Allen Dee and Hagen Glenda Kay
Current Estimated Value
Home Financials for this Owner
Home Financials are based on the most recent Mortgage that was taken out on this home.
Original Mortgage
$100,000
Outstanding Balance
$65,265
Interest Rate
5.07%
Estimated Equity
$133,255
Purchase Details
Closed on
Jun 18, 2008
Sold by
Williams Robert E and Williams Judy M
Bought by
Williams Robert E and Williams Judy M
Create a Home Valuation Report for This Property
The Home Valuation Report is an in-depth analysis detailing your home's value as well as a comparison with similar homes in the area
Home Values in the Area
Average Home Value in this Area
Purchase History
| Date | Buyer | Sale Price | Title Company |
|---|---|---|---|
| Hagen Allen Dee | -- | -- | |
| Williams Robert E | -- | -- |
Source: Public Records
Mortgage History
| Date | Status | Borrower | Loan Amount |
|---|---|---|---|
| Open | Hagen Allen Dee | $100,000 |
Source: Public Records
Tax History
| Year | Tax Paid | Tax Assessment Tax Assessment Total Assessment is a certain percentage of the fair market value that is determined by local assessors to be the total taxable value of land and additions on the property. | Land | Improvement |
|---|---|---|---|---|
| 2024 | $3,812 | $56,196 | $9,185 | $47,011 |
| 2023 | $3,582 | $52,034 | $8,505 | $43,529 |
| 2022 | $2,983 | $48,180 | $7,875 | $40,305 |
| 2021 | $2,871 | $45,886 | $7,500 | $38,386 |
| 2020 | $2,899 | $44,986 | $7,353 | $37,633 |
| 2019 | $2,927 | $44,986 | $7,353 | $37,633 |
| 2018 | $2,885 | $44,986 | $7,353 | $37,633 |
| 2017 | $3,251 | $44,540 | $7,280 | $37,260 |
| 2016 | $3,111 | $42,419 | $6,933 | $35,486 |
| 2015 | $2,999 | $40,787 | $6,666 | $34,121 |
| 2014 | $2,861 | $39,987 | $6,535 | $33,452 |
| 2013 | $2,515 | $36,618 | $5,985 | $30,633 |
Source: Public Records
Map
Nearby Homes
- 309 Larch Dr
- 439 E Glenwood Ave
- 601 E Lafayette St
- 701 S East St
- 1203 S Baltimore St
- 429 S Morgan St
- 530 S East St
- 525 S Grant St
- 333 S Richland St
- 213 S Morgan St
- 335 W Elm St
- 800 E Main St
- 502 W Chestnut St
- 310 S Adams St
- 1205 E Main St
- 1306 E Chestnut St
- 910 E Butler St
- 108 N Saratoga St
- 400 N Silver St
- 904 W Elm St
- 1103 S Maple St
- 1101 S Maple St
- 1206 S Morgan St
- 1105 S Maple St
- 1030 S Morgan St
- 1201 S Morgan St
- 1002 S Morgan St
- 1107 S Morgan St
- 221 E Esmeralda St
- 222 E Esmeralda St
- 1205 S Morgan St
- 219 E Esmeralda St
- 1000 S Morgan St
- 1101 S Morgan St
- 310 E Glenwood Ave
- 1100 S Maple St
- 1210 S Morgan St
- 217 E Esmeralda St
- 1077 S Morgan St
- 1104 S Maple St
Your Personal Tour Guide
Ask me questions while you tour the home.