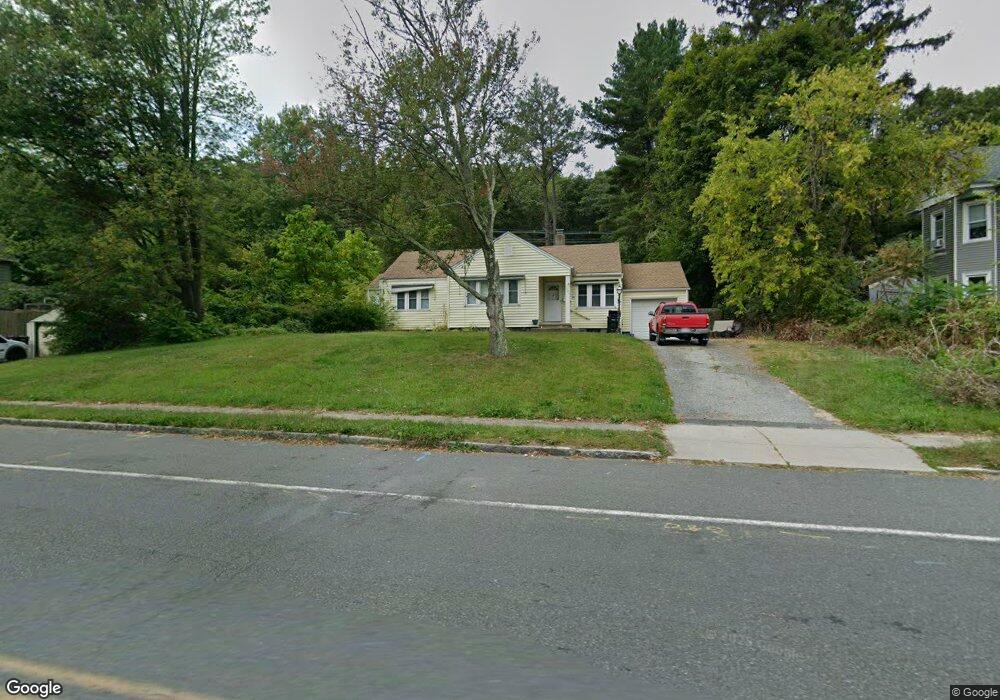
1121 Main St Holyoke, MA 01040
Estimated Value: $284,235 - $316,000
About This Home
This home is located at 1121 Main St, Holyoke, MA 01040 and is currently estimated at $294,059, approximately $238 per square foot. 1121 Main St is a home located in Hampden County with nearby schools including Maurice A. Donahue Elementary School, Holyoke High School, and Holyoke Community Charter School.
Ownership History
We collect this data history from publicly available records. To have your information removed, we recommend requesting removal directly through your county’s website.
Purchase Details
Home Financials for this Owner
Home Financials are based on the most recent Mortgage that was taken out on this home.Home Values in the Area
Average Home Value in this Area
Purchase History
We collect this data history from publicly available records. To have your information removed, we recommend requesting removal directly through your county’s website.
| Date | Buyer | Sale Price | Title Company |
|---|---|---|---|
| $140,000 | -- | ||
| $140,000 | -- |
Mortgage History
We collect this data history from publicly available records. To have your information removed, we recommend requesting removal directly through your county’s website.
| Date | Status | Borrower | Loan Amount |
|---|---|---|---|
| Open | $107,800 | ||
| Closed | $107,800 |
Tax History
We collect this data history from publicly available records. To have your information removed, we recommend requesting removal directly through your county’s website.
| Year | Tax Paid | Tax Assessment Tax Assessment Total Assessment is a certain percentage of the fair market value that is determined by local assessors to be the total taxable value of land and additions on the property. | Land | Improvement |
|---|---|---|---|---|
| 2025 | $3,820 | $218,800 | $43,800 | $175,000 |
| 2024 | $3,619 | $191,000 | $41,600 | $149,400 |
| 2023 | $3,459 | $184,400 | $41,600 | $142,800 |
| 2022 | $3,326 | $172,700 | $41,600 | $131,100 |
| 2021 | $5,611 | $161,800 | $37,800 | $124,000 |
| 2020 | $2,954 | $154,800 | $37,800 | $117,000 |
| 2019 | $5,262 | $148,100 | $33,500 | $114,600 |
| 2018 | $5,179 | $142,200 | $33,500 | $108,700 |
| 2017 | $2,726 | $142,200 | $33,500 | $108,700 |
| 2016 | $2,667 | $139,500 | $33,500 | $106,000 |
| 2015 | $2,656 | $139,500 | $33,500 | $106,000 |
Map
- 2 Oscar St
- 90 Mckinstry Ave Unit 117
- 90 Mckinstry Ave Unit 106
- 83 Mckinstry Ave
- 437 Chicopee St
- 38 Bonner St
- 5 Kurtz St
- 28 State St
- 94 Cora Ave
- 445 Oldfield Rd
- 55 Empire St Unit 11
- 958 Main St
- 77 Granville Ave
- 63 Stedman St
- 86 Beaumont Ave
- 51 Beaumont Ave
- 53 Highland Ln
- 13 Florence St
- 24-26 Gilman St
- 44 Wilson Ave
- 1117 Main St
- 1125 Main St
- 401 Ingleside St
- 405 Ingleside St
- 1112 Main St
- 1115 Main St Unit R1
- 1115 Main St
- 1115 Main St Unit 2L
- 415 Ingleside St
- 385 Ingleside St
- 1109 Main St
- 368 Ingleside St Unit 370
- 1107 Main St
- 23 Jones Ferry Rd
- 1106 Main St
- 1103 Main St
- 129 Lower Westfield Rd
- 366 Ingleside St
- 22 Lower Westfield Rd
- 1104 Main St
Ask me questions while you tour the home.