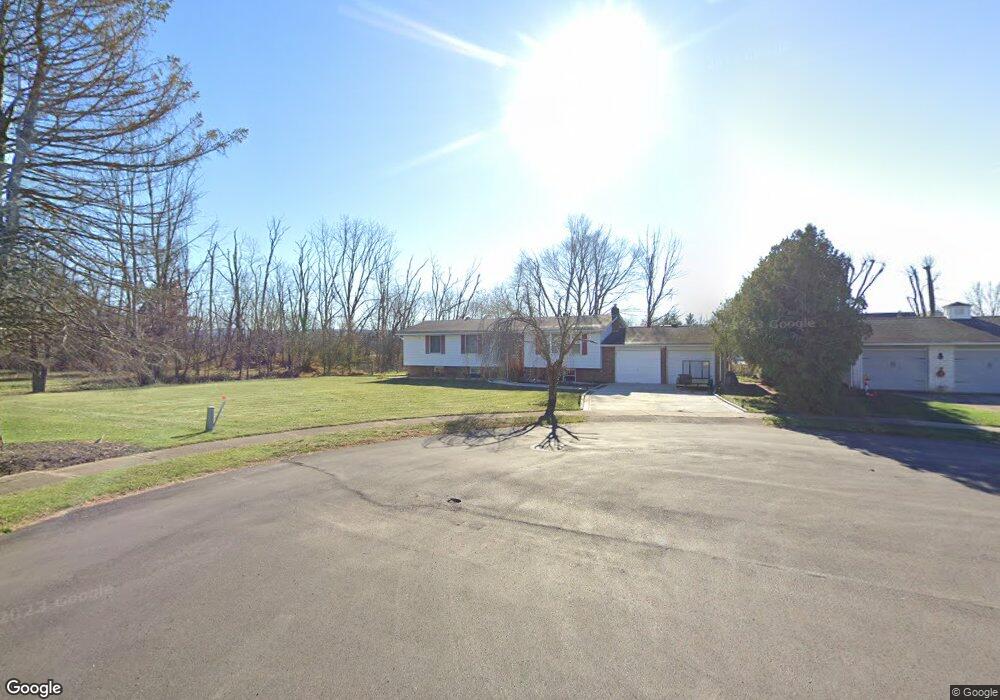
1122 Ruthann Dr Berwick, PA 18603
Estimated Value: $232,000 - $361,000
Studio
--
Bath
2,380
Sq Ft
$119/Sq Ft
Est. Value
About This Home
This home is located at 1122 Ruthann Dr, Berwick, PA 18603 and is currently estimated at $282,071, approximately $118 per square foot. 1122 Ruthann Dr is a home located in Luzerne County with nearby schools including Berwick Area High School, Holy Family Consolidated School, and New Story School.
Ownership History
Date
Name
Owned For
Owner Type
Purchase Details
Closed on
May 12, 2023
Sold by
Wetzel & Associates Llc
Bought by
Cruz Ismael and Cruz Patricia Marilu
Current Estimated Value
Purchase Details
Closed on
Oct 16, 2018
Sold by
Wilmington Savings Fund Society Fsb
Bought by
Cruz Ismael and Cruz Patricia M
Home Financials for this Owner
Home Financials are based on the most recent Mortgage that was taken out on this home.
Original Mortgage
$72,000
Interest Rate
4.8%
Mortgage Type
New Conventional
Purchase Details
Closed on
Jun 25, 2018
Sold by
May Sherry L and Federal National Mortgage Asso
Bought by
Wilmington Savings Fund Society Fsb and Christiana Trust
Purchase Details
Closed on
Nov 18, 1993
Bought by
May Robert J
Create a Home Valuation Report for This Property
The Home Valuation Report is an in-depth analysis detailing your home's value as well as a comparison with similar homes in the area
Home Values in the Area
Average Home Value in this Area
Purchase History
| Date | Buyer | Sale Price | Title Company |
|---|---|---|---|
| Cruz Ismael | $210,000 | None Listed On Document | |
| Cruz Ismael | $80,000 | Exact Abstract | |
| Wilmington Savings Fund Society Fsb | $1,453 | None Available | |
| May Robert J | -- | -- |
Source: Public Records
Mortgage History
| Date | Status | Borrower | Loan Amount |
|---|---|---|---|
| Previous Owner | Cruz Ismael | $72,000 |
Source: Public Records
Tax History
| Year | Tax Paid | Tax Assessment Tax Assessment Total Assessment is a certain percentage of the fair market value that is determined by local assessors to be the total taxable value of land and additions on the property. | Land | Improvement |
|---|---|---|---|---|
| 2026 | $3,819 | $167,300 | $43,500 | $123,800 |
| 2025 | $3,768 | $167,300 | $43,500 | $123,800 |
| 2024 | $3,655 | $167,300 | $43,500 | $123,800 |
| 2023 | $3,509 | $167,300 | $43,500 | $123,800 |
| 2022 | $3,478 | $167,300 | $43,500 | $123,800 |
| 2021 | $3,478 | $167,300 | $43,500 | $123,800 |
| 2020 | $3,005 | $167,300 | $43,500 | $123,800 |
| 2019 | $2,982 | $167,300 | $43,500 | $123,800 |
| 2018 | $2,960 | $167,300 | $43,500 | $123,800 |
| 2017 | $3,096 | $167,300 | $43,500 | $123,800 |
| 2016 | -- | $167,300 | $43,500 | $123,800 |
| 2015 | -- | $167,300 | $43,500 | $123,800 |
| 2014 | -- | $167,300 | $43,500 | $123,800 |
Source: Public Records
Map
Nearby Homes
Your Personal Tour Guide
Ask me questions while you tour the home.