1123 SE 211th Ct Gresham, OR 97030
North Central NeighborhoodEstimated Value: $426,000 - $460,080
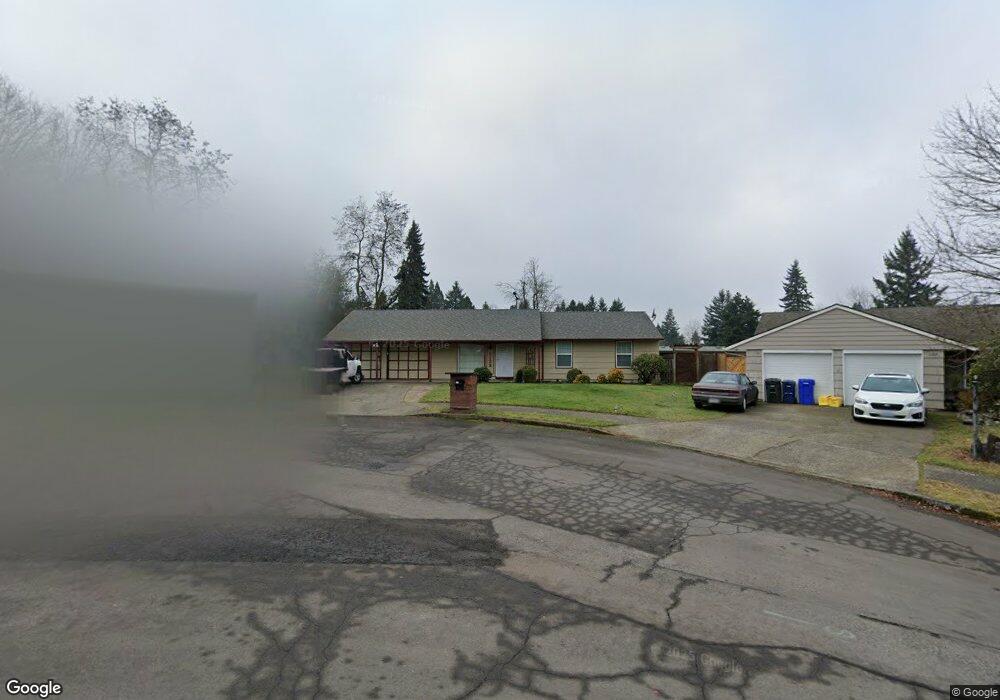
About This Home
This home is located at 1123 SE 211th Ct, Gresham, OR 97030 and is currently estimated at $440,770, approximately $344 per square foot. 1123 SE 211th Ct is a home located in Multnomah County with nearby schools including North Gresham Elementary School, Clear Creek Middle School, and Gresham High School.
Ownership History
We collect this data history from publicly available records. To have your information removed, we recommend requesting removal directly through your county’s website.
Purchase Details
Home Financials for this Owner
Home Financials are based on the most recent Mortgage that was taken out on this home.Home Values in the Area
Average Home Value in this Area
Purchase History
We collect this data history from publicly available records. To have your information removed, we recommend requesting removal directly through your county’s website.
| Date | Buyer | Sale Price | Title Company |
|---|---|---|---|
| $155,200 | Oregon Title Insurance Co |
Mortgage History
We collect this data history from publicly available records. To have your information removed, we recommend requesting removal directly through your county’s website.
| Date | Status | Borrower | Loan Amount |
|---|---|---|---|
| Open | $152,802 |
Tax History
We collect this data history from publicly available records. To have your information removed, we recommend requesting removal directly through your county’s website.
| Year | Tax Paid | Tax Assessment Tax Assessment Total Assessment is a certain percentage of the fair market value that is determined by local assessors to be the total taxable value of land and additions on the property. | Land | Improvement |
|---|---|---|---|---|
| 2025 | $4,323 | $212,420 | -- | -- |
| 2024 | $4,138 | $206,240 | -- | -- |
| 2023 | $3,770 | $200,240 | $0 | $0 |
| 2022 | $3,665 | $194,410 | $0 | $0 |
| 2021 | $3,572 | $188,750 | $0 | $0 |
| 2020 | $3,361 | $183,260 | $0 | $0 |
| 2019 | $3,273 | $177,930 | $0 | $0 |
| 2018 | $3,121 | $172,750 | $0 | $0 |
| 2017 | $2,995 | $167,720 | $0 | $0 |
| 2016 | $2,640 | $162,840 | $0 | $0 |
| 2015 | $2,583 | $158,100 | $0 | $0 |
| 2014 | $2,520 | $153,500 | $0 | $0 |
Map
- 21224 SE Yamhill St
- 21304 SE Yamhill St
- 21016 SE Stark St Unit 71
- 21016 SE Stark St Unit 69
- 1230 SE 214th Ave
- 2013 NW Bella Vista Dr
- 1520 SE 210th Ave
- 21260 SE Stark St
- 21532 SE Alder St
- 581 SE 204th Place
- 1258 NW Shattuck Way Unit 308
- 1802 NW Bella Vista Ave
- 1926 NW 18th St
- 1207 SE 217th Ave
- 866 NW Council Dr
- 830 NW Council Dr
- 826 NW Council Dr
- 21525 SE Oak St
- 1987 NW 17th St
- 2243 NW Norman Ave
- 21100 SE Taylor Ct
- 1107 SE 211th Ct
- 1120 SE 210th Ave
- 1132 SE 210th Ave
- 21025 SE Salmon St
- 1108 SE 210th Ave
- 21017 SE Salmon St
- 21110 SE Taylor Ct
- 21033 SE Salmon St
- 1017 SE 211th Ct
- 1144 SE 210th Ave
- 1022 SE 210th Ave
- 21041 SE Salmon St
- 1100 SE 211th Ct
- 21118 SE Taylor Ct
- 1127 SE 210th Ave
- 1115 SE 210th Ave
- 21020 SE Yamhill St
- 1007 SE 211th Ct
- 21101 SE Salmon St
Ask me questions while you tour the home.