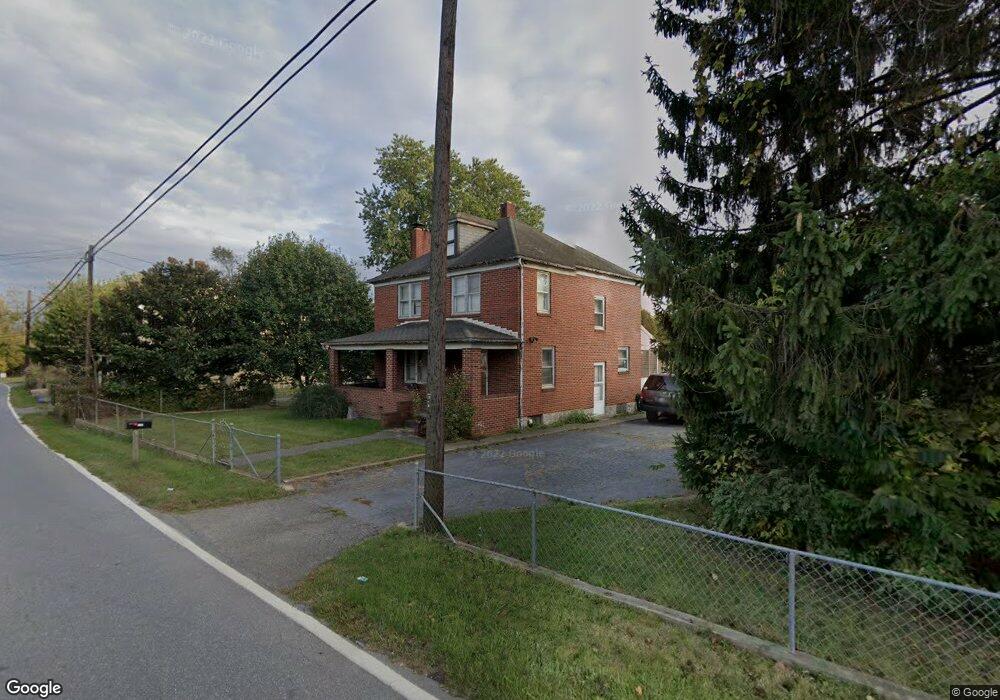
1123 Security Rd Hagerstown, MD 21742
Northeast Hagerstown NeighborhoodEstimated Value: $272,832 - $310,000
Studio
2
Baths
1,492
Sq Ft
$194/Sq Ft
Est. Value
About This Home
This home is located at 1123 Security Rd, Hagerstown, MD 21742 and is currently estimated at $289,708, approximately $194 per square foot. 1123 Security Rd is a home located in Washington County with nearby schools including Pangborn Elementary School, Northern Middle School, and North Hagerstown High School.
Ownership History
Date
Name
Owned For
Owner Type
Purchase Details
Closed on
Nov 13, 2007
Sold by
Kidwell James R and Kidwell Jodi D
Bought by
Kidwell James R
Current Estimated Value
Home Financials for this Owner
Home Financials are based on the most recent Mortgage that was taken out on this home.
Original Mortgage
$162,700
Outstanding Balance
$103,101
Interest Rate
6.41%
Mortgage Type
Stand Alone Refi Refinance Of Original Loan
Estimated Equity
$186,607
Purchase Details
Closed on
Nov 1, 2007
Sold by
Kidwell James R and Kidwell Jodi D
Bought by
Kidwell James R
Home Financials for this Owner
Home Financials are based on the most recent Mortgage that was taken out on this home.
Original Mortgage
$162,700
Outstanding Balance
$103,101
Interest Rate
6.41%
Mortgage Type
Stand Alone Refi Refinance Of Original Loan
Estimated Equity
$186,607
Purchase Details
Closed on
Mar 5, 1999
Sold by
Marie Marconi
Bought by
Kidwell James R and Kidwell Jodi D
Create a Home Valuation Report for This Property
The Home Valuation Report is an in-depth analysis detailing your home's value as well as a comparison with similar homes in the area
Home Values in the Area
Average Home Value in this Area
Purchase History
| Date | Buyer | Sale Price | Title Company |
|---|---|---|---|
| Kidwell James R | -- | -- | |
| Kidwell James R | -- | -- | |
| Kidwell James R | $105,000 | -- |
Source: Public Records
Mortgage History
| Date | Status | Borrower | Loan Amount |
|---|---|---|---|
| Open | Kidwell James R | $162,700 | |
| Closed | Kidwell James R | $162,700 | |
| Closed | Kidwell James R | -- |
Source: Public Records
Tax History
| Year | Tax Paid | Tax Assessment Tax Assessment Total Assessment is a certain percentage of the fair market value that is determined by local assessors to be the total taxable value of land and additions on the property. | Land | Improvement |
|---|---|---|---|---|
| 2025 | $1,695 | $189,533 | $0 | $0 |
| 2024 | $1,695 | $163,700 | $49,500 | $114,200 |
| 2023 | $1,595 | $154,067 | $0 | $0 |
| 2022 | $1,495 | $144,433 | $0 | $0 |
| 2021 | $1,420 | $134,800 | $49,500 | $85,300 |
| 2020 | $1,420 | $134,600 | $0 | $0 |
| 2019 | $1,425 | $134,400 | $0 | $0 |
| 2018 | $1,423 | $134,200 | $49,500 | $84,700 |
| 2017 | $1,423 | $134,200 | $0 | $0 |
| 2016 | -- | $134,200 | $0 | $0 |
| 2015 | $1,743 | $140,800 | $0 | $0 |
| 2014 | $1,743 | $140,800 | $0 | $0 |
Source: Public Records
Map
Nearby Homes
- 486 Antietam Dr
- 313 Sunbrook Ln Unit 95
- 319 Sunbrook Ln Unit 98
- 1023 Klick Way
- 344 Hollymead Terrace
- 340 Sunbrook Ln
- 43 Sunbrook Ln Unit 6
- 466 Pangborn Blvd
- 811 Antietam Dr
- 1275 Jefferson Blvd
- 0 Jefferson Blvd Unit MDWA2032528
- 1056 Valleybrook Dr
- 1394 Jefferson Blvd
- 1001 Jefferson Blvd
- 942 Monet Dr
- 232 E Irvin Ave
- 207 E Irvin Ave
- 752 Monet Dr
- 953 View St
- 939 View St
- 1129 Security Rd
- 1126 Security Rd
- 1128 Security Rd
- 1132 Security Rd
- 455 Antietam Dr
- 451 Antietam Dr
- 1052 Security Rd
- 443 Antietam Dr
- 1051 Security Rd
- 1050 Security Rd
- 0 Antietam Dr
- 458 Antietam Dr
- 1049 Security Rd
- 1046 Security Rd
- 479 Antietam Dr
- 1042 Security Rd
- 1045 Security Rd
- 485 Antietam Dr
- 1043 Security Rd
- 1210 Security Rd
Your Personal Tour Guide
Ask me questions while you tour the home.