Estimated Value: $141,814 - $199,000
3
Beds
1
Bath
1,558
Sq Ft
$112/Sq Ft
Est. Value
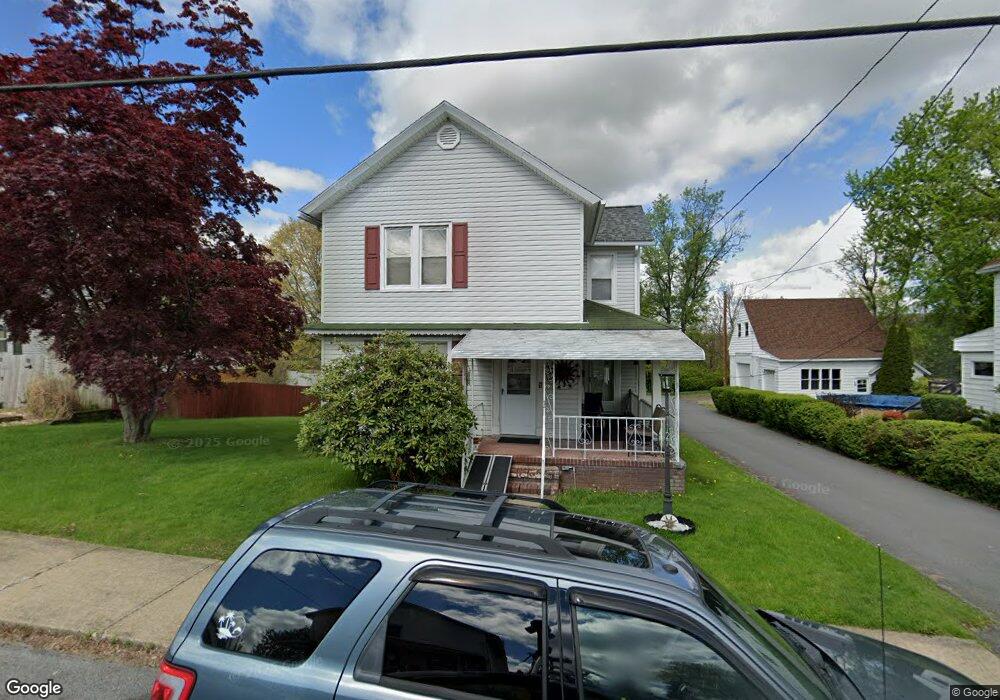
About This Home
This home is located at 1127 Spring St, Avoca, PA 18641 and is currently estimated at $174,204, approximately $111 per square foot. 1127 Spring St is a home located in Luzerne County with nearby schools including Pittston City Intermediate Center, Pittston Area Middle School, and Pittston Area Senior High School.
Ownership History
Date
Name
Owned For
Owner Type
Purchase Details
Closed on
Nov 21, 2014
Sold by
Christiana Trust
Bought by
Konopka Joan and Jones Christine
Current Estimated Value
Home Financials for this Owner
Home Financials are based on the most recent Mortgage that was taken out on this home.
Original Mortgage
$48,925
Outstanding Balance
$36,832
Interest Rate
3.93%
Mortgage Type
New Conventional
Estimated Equity
$137,372
Purchase Details
Closed on
Jul 15, 2014
Sold by
Lane Santa M and Lane Joseph M
Bought by
Christiana Trust
Create a Home Valuation Report for This Property
The Home Valuation Report is an in-depth analysis detailing your home's value as well as a comparison with similar homes in the area
Home Values in the Area
Average Home Value in this Area
Purchase History
| Date | Buyer | Sale Price | Title Company |
|---|---|---|---|
| Konopka Joan | $51,500 | None Available | |
| Christiana Trust | $103,835 | None Available |
Source: Public Records
Mortgage History
| Date | Status | Borrower | Loan Amount |
|---|---|---|---|
| Open | Konopka Joan | $48,925 |
Source: Public Records
Tax History
| Year | Tax Paid | Tax Assessment Tax Assessment Total Assessment is a certain percentage of the fair market value that is determined by local assessors to be the total taxable value of land and additions on the property. | Land | Improvement |
|---|---|---|---|---|
| 2026 | $1,418 | $55,200 | $26,000 | $29,200 |
| 2025 | $1,413 | $55,200 | $26,000 | $29,200 |
| 2024 | $1,413 | $55,200 | $26,000 | $29,200 |
| 2023 | $1,385 | $55,200 | $26,000 | $29,200 |
| 2022 | $1,359 | $55,200 | $26,000 | $29,200 |
| 2021 | $1,359 | $55,200 | $26,000 | $29,200 |
| 2020 | $1,328 | $55,200 | $26,000 | $29,200 |
| 2019 | $1,300 | $55,200 | $26,000 | $29,200 |
| 2018 | $1,273 | $55,200 | $26,000 | $29,200 |
| 2017 | $1,245 | $55,200 | $26,000 | $29,200 |
| 2016 | -- | $55,200 | $26,000 | $29,200 |
| 2015 | $1,804 | $100,900 | $31,400 | $69,500 |
| 2014 | $1,804 | $100,900 | $31,400 | $69,500 |
Source: Public Records
Map
Nearby Homes
- 1009 Grove St
- 1309 South St
- 0 South St
- 732 Main St
- 107 Stonecrest Dr
- 823 Mcalpine St
- 600 Center St
- 742 Donnelly St
- 616 Donnelly St
- 616 Rear Donnelly St
- 127 Broadhead St
- 527 Minooka Ave
- 120 Parkcrest Dr
- 398 N River St
- 424 New St
- 1061 Springbrook Ave
- 347 Orchard St
- 320 Edward St
- 1114 Springbrook Ave Unit REAR
- 828 Glenwood Rd
Your Personal Tour Guide
Ask me questions while you tour the home.