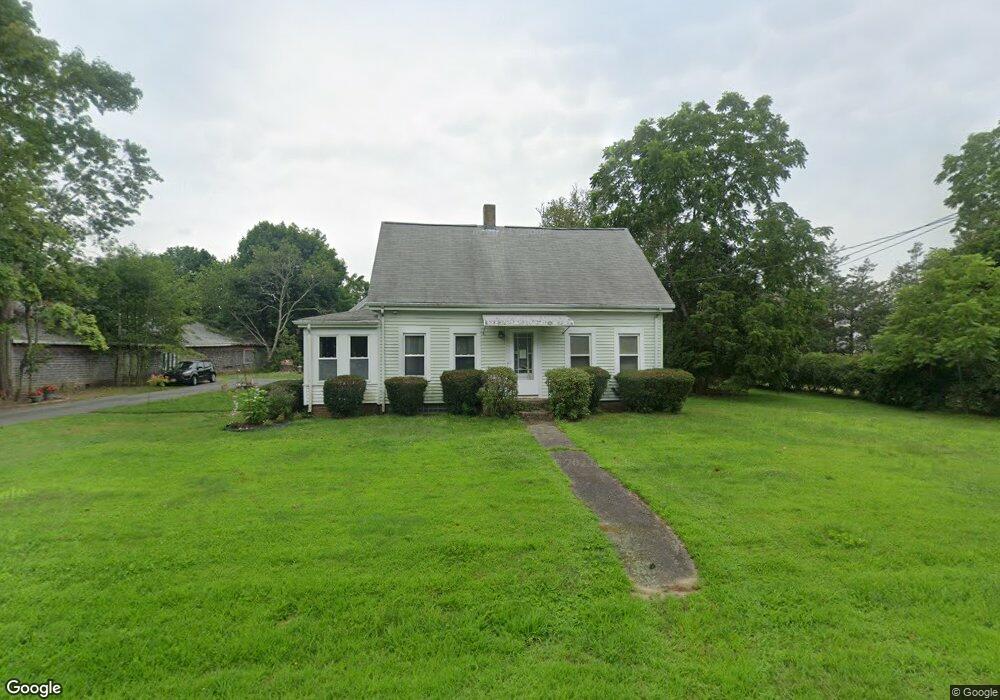
1129 Main St Acushnet, MA 02743
Estimated Value: $484,174 - $625,000
Studio
1
Bath
1,801
Sq Ft
$315/Sq Ft
Est. Value
About This Home
This home is located at 1129 Main St, Acushnet, MA 02743 and is currently estimated at $566,794, approximately $314 per square foot. 1129 Main St is a home located in Bristol County with nearby schools including Acushnet Elementary School, Albert F Ford Middle School, and St Francis Xavier Elementary School.
Ownership History
Date
Name
Owned For
Owner Type
Purchase Details
Closed on
Mar 14, 2019
Sold by
Nunes Stephen D and Nunes Linda A
Bought by
Nunes Ft and Nunes
Current Estimated Value
Purchase Details
Closed on
Apr 25, 1989
Sold by
Woodview Corp
Bought by
Nunes Stephen D
Create a Home Valuation Report for This Property
The Home Valuation Report is an in-depth analysis detailing your home's value as well as a comparison with similar homes in the area
Purchase History
We collect this data history from publicly available records. To have your information removed, we recommend requesting removal directly through your county’s website.
| Date | Buyer | Sale Price | Title Company |
|---|---|---|---|
| Nunes Ft | -- | -- | |
| Nunes Stephen D | $117,000 | -- |
Source: Public Records
Mortgage History
We collect this data history from publicly available records. To have your information removed, we recommend requesting removal directly through your county’s website.
| Date | Status | Borrower | Loan Amount |
|---|---|---|---|
| Previous Owner | Nunes Stephen D | $161,000 | |
| Previous Owner | Nunes Stephen D | $25,000 | |
| Previous Owner | Nunes Stephen D | $7,000 | |
| Previous Owner | Nunes Stephen D | $106,400 |
Source: Public Records
Tax History
| Year | Tax Paid | Tax Assessment Tax Assessment Total Assessment is a certain percentage of the fair market value that is determined by local assessors to be the total taxable value of land and additions on the property. | Land | Improvement |
|---|---|---|---|---|
| 2025 | $46 | $428,400 | $142,000 | $286,400 |
| 2024 | $4,638 | $406,500 | $134,600 | $271,900 |
| 2023 | $4,391 | $365,900 | $122,100 | $243,800 |
| 2022 | $4,500 | $339,100 | $114,600 | $224,500 |
| 2021 | $4,189 | $302,900 | $114,600 | $188,300 |
| 2020 | $4,119 | $295,500 | $107,200 | $188,300 |
| 2019 | $3,924 | $276,700 | $102,200 | $174,500 |
| 2018 | $3,827 | $265,400 | $102,200 | $163,200 |
| 2017 | $3,717 | $257,400 | $102,200 | $155,200 |
| 2016 | $3,563 | $245,200 | $102,200 | $143,000 |
| 2015 | $3,501 | $245,200 | $102,200 | $143,000 |
Source: Public Records
Map
Nearby Homes
- 47 Clems Way Unit 47
- 219 Leonard St
- 0 Land Way Unit 73479153
- 853 Main St
- 13 Bow Dr
- 0 Keene Rd Unit 73459818
- 2323 Robinson Rd
- 0 Rounseville Rd
- 17 David St
- 67 Morses Ln
- 79 Park Dr
- 6 Evergreen Dr
- 973 Pembroke St
- 47 Seth Daniel Dr
- SS Charbonneau Ln
- 39 Nyes Ln
- 390 Upland St
- 37 Crestwood Cir Unit 37
- 36 Crestwood Cir Unit 36
- 363 Main St
Your Personal Tour Guide
Ask me questions while you tour the home.