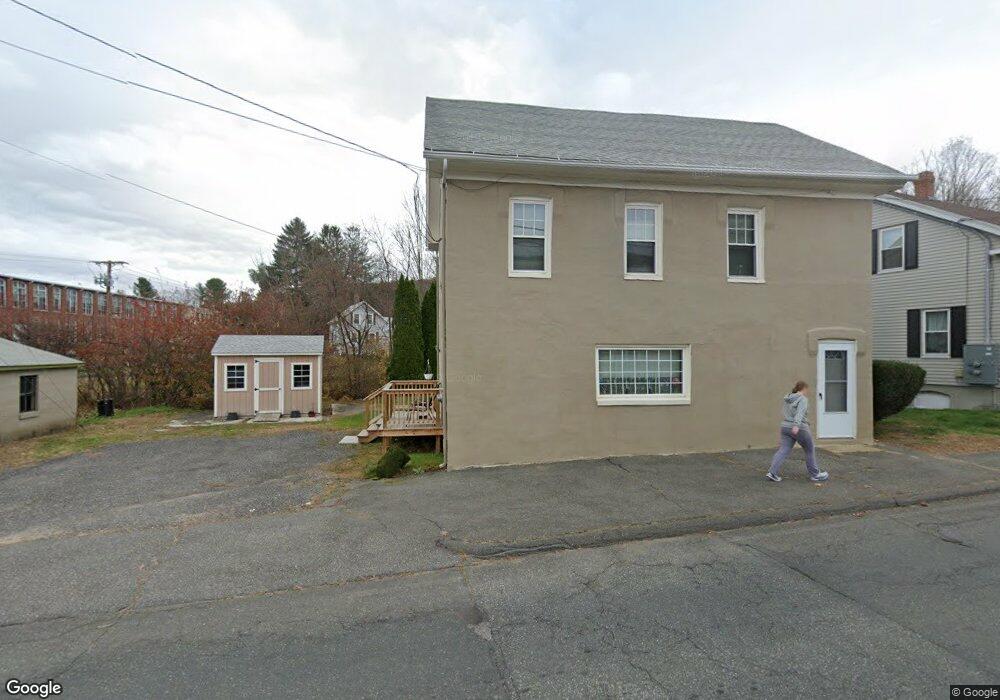
113 Brook Rd Warren, MA 01083
Estimated Value: $220,000 - $377,000
2
Beds
2
Baths
1,440
Sq Ft
$207/Sq Ft
Est. Value
About This Home
This home is located at 113 Brook Rd, Warren, MA 01083 and is currently estimated at $297,476, approximately $206 per square foot. 113 Brook Rd is a home with nearby schools including Quaboag Regional High School.
Ownership History
Date
Name
Owned For
Owner Type
Purchase Details
Closed on
Jan 17, 2024
Sold by
Sablack Shirley M
Bought by
Jusko Tyler
Current Estimated Value
Home Financials for this Owner
Home Financials are based on the most recent Mortgage that was taken out on this home.
Original Mortgage
$67,500
Outstanding Balance
$66,213
Interest Rate
7.03%
Mortgage Type
New Conventional
Estimated Equity
$231,263
Purchase Details
Closed on
Sep 1, 2010
Sold by
Sablack John S Est and Dusza
Bought by
Sablack Shirley M
Create a Home Valuation Report for This Property
The Home Valuation Report is an in-depth analysis detailing your home's value as well as a comparison with similar homes in the area
Home Values in the Area
Average Home Value in this Area
Purchase History
| Date | Buyer | Sale Price | Title Company |
|---|---|---|---|
| Jusko Tyler | $90,000 | None Available | |
| Sablack Shirley M | $25,000 | -- |
Source: Public Records
Mortgage History
| Date | Status | Borrower | Loan Amount |
|---|---|---|---|
| Open | Jusko Tyler | $67,500 |
Source: Public Records
Tax History
| Year | Tax Paid | Tax Assessment Tax Assessment Total Assessment is a certain percentage of the fair market value that is determined by local assessors to be the total taxable value of land and additions on the property. | Land | Improvement |
|---|---|---|---|---|
| 2025 | $2,543 | $171,700 | $40,700 | $131,000 |
| 2024 | $2,588 | $171,700 | $40,700 | $131,000 |
| 2023 | $2,534 | $160,400 | $40,700 | $119,700 |
| 2022 | $2,252 | $144,700 | $35,100 | $109,600 |
| 2021 | $2,198 | $137,700 | $33,100 | $104,600 |
| 2020 | $2,169 | $126,400 | $33,100 | $93,300 |
| 2019 | $2,176 | $119,900 | $33,100 | $86,800 |
| 2018 | $1,910 | $110,300 | $33,100 | $77,200 |
| 2017 | $1,982 | $106,800 | $34,400 | $72,400 |
| 2016 | $2,034 | $102,500 | $32,800 | $69,700 |
| 2015 | $1,838 | $98,000 | $32,800 | $65,200 |
| 2014 | $1,918 | $100,400 | $32,800 | $67,600 |
Source: Public Records
Map
Nearby Homes
Your Personal Tour Guide
Ask me questions while you tour the home.