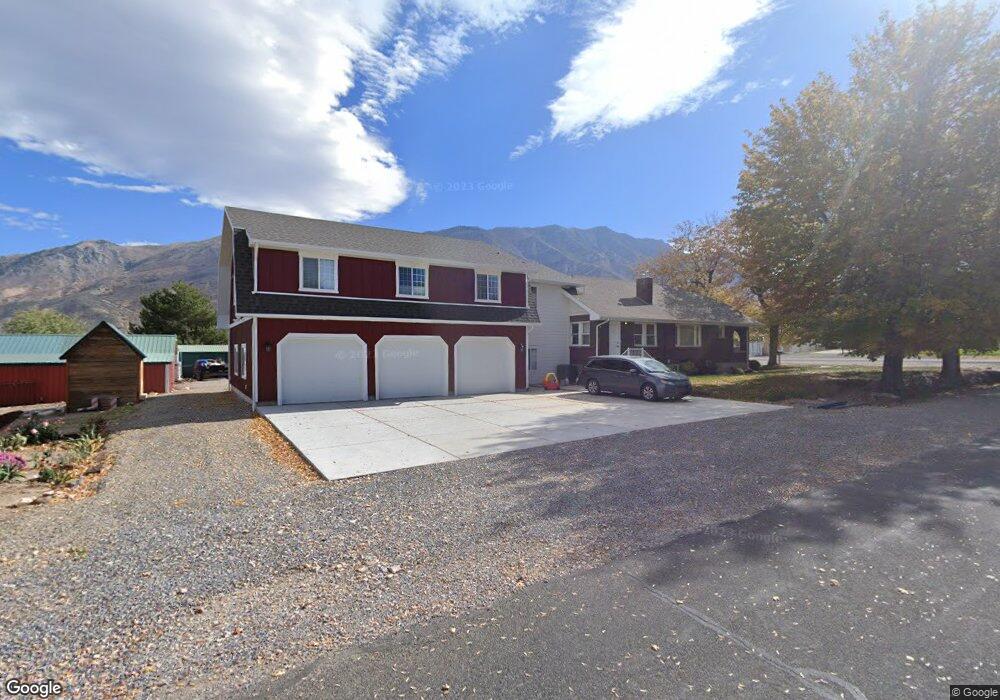
113 E 200 N Santaquin, UT 84655
Estimated Value: $526,000 - $699,000
4
Beds
2
Baths
3,121
Sq Ft
$208/Sq Ft
Est. Value
About This Home
This home is located at 113 E 200 N, Santaquin, UT 84655 and is currently estimated at $649,544, approximately $208 per square foot. 113 E 200 N is a home located in Utah County with nearby schools including Apple Valley Elementary, Payson Junior High School, and Mt. Nebo Middle.
Ownership History
Date
Name
Owned For
Owner Type
Purchase Details
Closed on
Aug 21, 2017
Sold by
Jensen Neal R
Bought by
Sec 051 Llc
Current Estimated Value
Purchase Details
Closed on
Mar 17, 2010
Sold by
Lebaron Wayne E and Lebaron Shirlene T
Bought by
Jensen Neal R
Home Financials for this Owner
Home Financials are based on the most recent Mortgage that was taken out on this home.
Original Mortgage
$186,558
Interest Rate
5%
Mortgage Type
FHA
Create a Home Valuation Report for This Property
The Home Valuation Report is an in-depth analysis detailing your home's value as well as a comparison with similar homes in the area
Home Values in the Area
Average Home Value in this Area
Purchase History
| Date | Buyer | Sale Price | Title Company |
|---|---|---|---|
| Sec 051 Llc | -- | Stewart Title Ins Agency Of | |
| Jensen Neal R | -- | Title West Spanish Fork |
Source: Public Records
Mortgage History
| Date | Status | Borrower | Loan Amount |
|---|---|---|---|
| Previous Owner | Jensen Neal R | $186,558 |
Source: Public Records
Tax History
| Year | Tax Paid | Tax Assessment Tax Assessment Total Assessment is a certain percentage of the fair market value that is determined by local assessors to be the total taxable value of land and additions on the property. | Land | Improvement |
|---|---|---|---|---|
| 2025 | $2,822 | $327,030 | -- | -- |
| 2024 | $2,822 | $280,995 | $0 | $0 |
| 2023 | $2,269 | $226,655 | $0 | $0 |
| 2022 | $2,106 | $217,030 | $0 | $0 |
| 2021 | $1,721 | $274,900 | $101,900 | $173,000 |
| 2020 | $1,632 | $252,600 | $88,600 | $164,000 |
| 2019 | $1,430 | $226,300 | $83,700 | $142,600 |
| 2018 | $1,343 | $202,700 | $78,700 | $124,000 |
| 2017 | $1,298 | $104,665 | $0 | $0 |
| 2016 | $1,159 | $91,575 | $0 | $0 |
| 2015 | $1,116 | $86,460 | $0 | $0 |
| 2014 | $1,107 | $85,580 | $0 | $0 |
Source: Public Records
Map
Nearby Homes
Your Personal Tour Guide
Ask me questions while you tour the home.