113 E Main St Arcadia, IN 46030
Estimated Value: $124,025
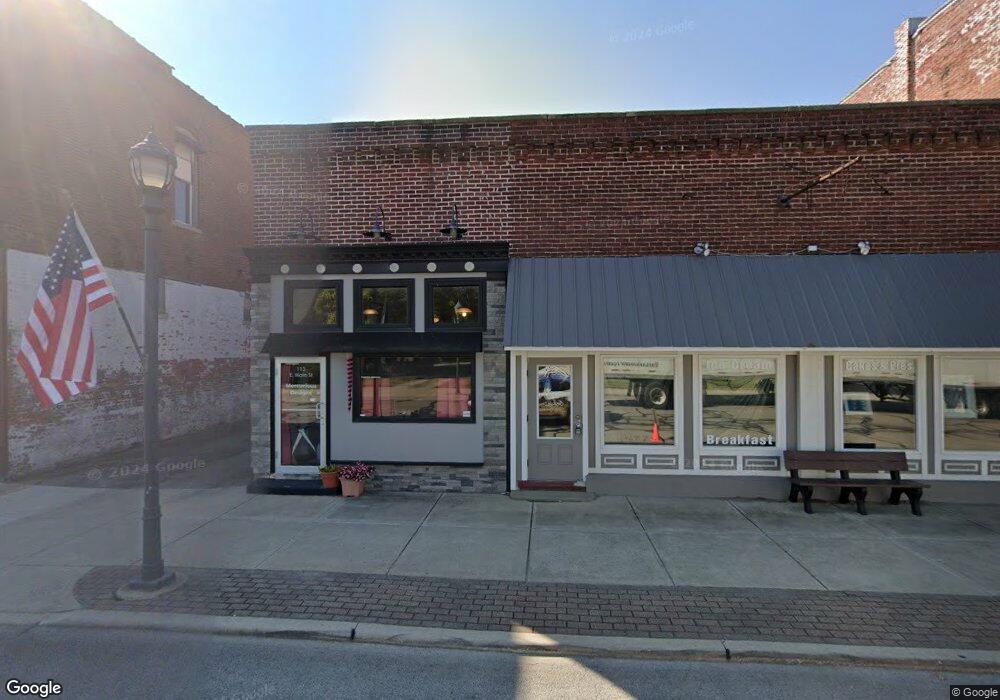
About This Home
This home is located at 113 E Main St, Arcadia, IN 46030 and is currently estimated at $124,025, approximately $103 per square foot. 113 E Main St is a home located in Hamilton County with nearby schools including Hamilton Heights Elementary School, Hamilton Heights Middle School, and Hamilton Heights High School.
Ownership History
We collect this data history from publicly available records. To have your information removed, we recommend requesting removal directly through your county’s website.
Purchase Details
Home Financials for this Owner
Home Financials are based on the most recent Mortgage that was taken out on this home.Purchase Details
Home Financials for this Owner
Home Financials are based on the most recent Mortgage that was taken out on this home.Purchase History
We collect this data history from publicly available records. To have your information removed, we recommend requesting removal directly through your county’s website.
| Date | Buyer | Sale Price | Title Company |
|---|---|---|---|
| -- | Title Solutions Plus Corpora | ||
| -- | Stewart Title |
Mortgage History
We collect this data history from publicly available records. To have your information removed, we recommend requesting removal directly through your county’s website.
| Date | Status | Borrower | Loan Amount |
|---|---|---|---|
| Open | $108,800 | ||
| Previous Owner | $20,323 | ||
| Previous Owner | $18,000 |
Tax History
We collect this data history from publicly available records. To have your information removed, we recommend requesting removal directly through your county’s website.
| Year | Tax Paid | Tax Assessment Tax Assessment Total Assessment is a certain percentage of the fair market value that is determined by local assessors to be the total taxable value of land and additions on the property. | Land | Improvement |
|---|---|---|---|---|
| 2025 | $1,373 | $50,700 | $9,600 | $41,100 |
| 2024 | $1,144 | $50,100 | $9,600 | $40,500 |
| 2023 | $1,339 | $46,400 | $7,500 | $38,900 |
| 2022 | $1,349 | $46,400 | $7,500 | $38,900 |
| 2021 | $1,363 | $45,000 | $7,500 | $37,500 |
| 2020 | $1,347 | $45,000 | $7,500 | $37,500 |
| 2019 | $1,337 | $44,300 | $7,500 | $36,800 |
| 2018 | $1,295 | $43,200 | $7,500 | $35,700 |
| 2017 | $1,303 | $42,600 | $7,500 | $35,100 |
| 2016 | $1,277 | $42,600 | $7,500 | $35,100 |
| 2014 | $1,114 | $43,100 | $7,500 | $35,600 |
| 2013 | $1,114 | $43,100 | $7,500 | $35,600 |
Map
- 216 W Main St
- 404 E Madison Ave
- 503 E Main St
- 513 Howard Ave
- 26595 Scherer Ave
- 565 Melbrook St
- 9131 E 256th St
- 544 Wise Way
- 9135 E 256th St
- 0 E 266th St Unit MBR22081757
- 25575 State Road 19
- 26595 Mount Pleasant Rd
- 25541 Scherer Ave
- 28615 N State Road 19
- 1175 Coral Springs Dr
- 180 Bayshore Dr
- 129 Bayshore Dr
- 370 N Peru St
- 17 Point Ln
- 117 Cottonwood Dr
- 111 E Main St
- 100 E South St
- 102 E South St
- 104 S St E
- 105 S East St
- 105 E South St
- 107 S E St Unit A
- 110 E Main St
- 101 W Main St
- 101 E Main St
- 106 E Main St
- 107 S East St
- 110 S Washington St N
- 101 E South St
- 120 W Main St
- 109 W Main St
- 107 E South St
- 205 W Main St
- 202 E South St
- 103 N Washington St
Ask me questions while you tour the home.