113 Green St Saint Michaels, MD 21663
Estimated Value: $944,034 - $1,125,000
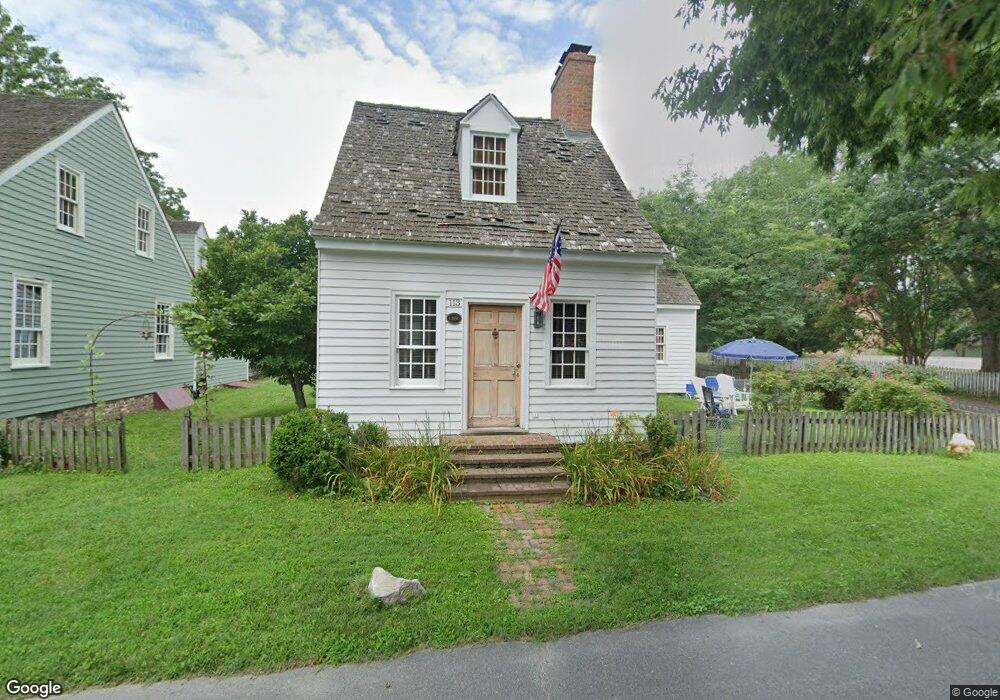
About This Home
This home is located at 113 Green St, Saint Michaels, MD 21663 and is currently estimated at $1,020,509, approximately $766 per square foot. 113 Green St is a home located in Talbot County with nearby schools including St. Michaels Elementary School, St. Michaels Middle/High School, and Easton High School.
Ownership History
We collect this data history from publicly available records. To have your information removed, we recommend requesting removal directly through your county’s website.
Purchase Details
Home Financials for this Owner
Home Financials are based on the most recent Mortgage that was taken out on this home.Purchase Details
Home Financials for this Owner
Home Financials are based on the most recent Mortgage that was taken out on this home.Purchase Details
Home Financials for this Owner
Home Financials are based on the most recent Mortgage that was taken out on this home.Purchase Details
Purchase Details
Purchase Details
Purchase Details
Home Values in the Area
Average Home Value in this Area
Purchase History
We collect this data history from publicly available records. To have your information removed, we recommend requesting removal directly through your county’s website.
| Date | Buyer | Sale Price | Title Company |
|---|---|---|---|
| $515,000 | None Available | ||
| $739,000 | -- | ||
| $739,000 | -- | ||
| $640,000 | -- | ||
| $640,000 | -- | ||
| $359,000 | -- | ||
| $53,000 | -- |
Mortgage History
We collect this data history from publicly available records. To have your information removed, we recommend requesting removal directly through your county’s website.
| Date | Status | Borrower | Loan Amount |
|---|---|---|---|
| Open | $220,000 | ||
| Closed | $220,000 | ||
| Previous Owner | $230,000 | ||
| Previous Owner | $230,000 |
Tax History
We collect this data history from publicly available records. To have your information removed, we recommend requesting removal directly through your county’s website.
| Year | Tax Paid | Tax Assessment Tax Assessment Total Assessment is a certain percentage of the fair market value that is determined by local assessors to be the total taxable value of land and additions on the property. | Land | Improvement |
|---|---|---|---|---|
| 2025 | $6,813 | $661,700 | $302,900 | $358,800 |
| 2024 | $6,701 | $619,500 | $0 | $0 |
| 2023 | $6,402 | $577,300 | $0 | $0 |
| 2022 | $6,135 | $535,100 | $257,400 | $277,700 |
| 2021 | $6,000 | $535,100 | $257,400 | $277,700 |
| 2020 | $6,078 | $535,100 | $257,400 | $277,700 |
| 2019 | $6,129 | $539,600 | $258,600 | $281,000 |
| 2018 | $5,993 | $537,400 | $0 | $0 |
| 2017 | $5,779 | $535,200 | $0 | $0 |
| 2016 | $5,131 | $533,000 | $0 | $0 |
| 2015 | $6,355 | $533,100 | $0 | $0 |
| 2014 | $6,355 | $551,200 | $0 | $0 |
Map
- 205 Cherry St
- 101 Mulberry St
- 203 Canton St
- 107 E Chestnut St
- 113 Gloria Ave
- 202 E Chestnut St
- 222 E Chestnut St
- 203 E Chew Ave
- 101 Brooks Ln
- 114 E Chew Ave
- 121 W Chestnut St
- 114 W Chestnut St
- 216 E Chew Ave
- 204 E Marengo St
- 109 W Marengo St
- 303 Manor St
- Lot 16A Meadow St
- 105 Seymour Ave
- 228 Perry Cabin Dr Unit 228 / 226
- 807 Radcliff Ave
Ask me questions while you tour the home.