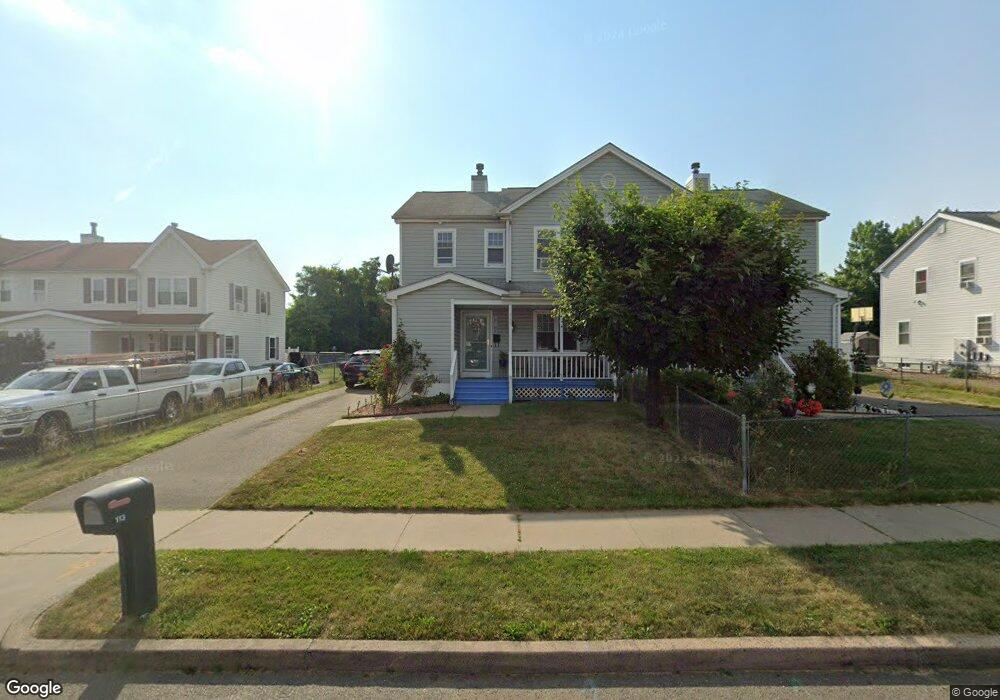
113 Hampton St Unit 113 Hartford, CT 06120
North End NeighborhoodEstimated Value: $224,000 - $297,000
3
Beds
2
Baths
1,544
Sq Ft
$160/Sq Ft
Est. Value
About This Home
This home is located at 113 Hampton St Unit 113, Hartford, CT 06120 and is currently estimated at $246,983, approximately $159 per square foot. 113 Hampton St Unit 113 is a home located in Hartford County with nearby schools including Capital Preparatory Magnet School, Sand Elementary School, and Ib Global Communications Academy.
Ownership History
Date
Name
Owned For
Owner Type
Purchase Details
Closed on
Aug 31, 2015
Sold by
Webster Bank Na
Bought by
Scott Nadine
Current Estimated Value
Home Financials for this Owner
Home Financials are based on the most recent Mortgage that was taken out on this home.
Original Mortgage
$73,641
Outstanding Balance
$57,082
Interest Rate
4.09%
Mortgage Type
FHA
Estimated Equity
$189,901
Purchase Details
Closed on
Jan 15, 2015
Sold by
Dinkins Shardick and Webster Bank
Bought by
Webster Bank
Purchase Details
Closed on
Jun 16, 2008
Sold by
Hartford Housing Auth
Bought by
Dinkins Shadrick and Dinkins Sherrie
Home Financials for this Owner
Home Financials are based on the most recent Mortgage that was taken out on this home.
Original Mortgage
$85,000
Interest Rate
6.13%
Mortgage Type
Purchase Money Mortgage
Create a Home Valuation Report for This Property
The Home Valuation Report is an in-depth analysis detailing your home's value as well as a comparison with similar homes in the area
Home Values in the Area
Average Home Value in this Area
Purchase History
| Date | Buyer | Sale Price | Title Company |
|---|---|---|---|
| Scott Nadine | $75,000 | -- | |
| Webster Bank | -- | -- | |
| Dinkins Shadrick | $100,000 | -- |
Source: Public Records
Mortgage History
| Date | Status | Borrower | Loan Amount |
|---|---|---|---|
| Open | Dinkins Shadrick | $73,641 | |
| Previous Owner | Dinkins Shadrick | $85,000 | |
| Previous Owner | Dinkins Shadrick | $20,000 |
Source: Public Records
Tax History
| Year | Tax Paid | Tax Assessment Tax Assessment Total Assessment is a certain percentage of the fair market value that is determined by local assessors to be the total taxable value of land and additions on the property. | Land | Improvement |
|---|---|---|---|---|
| 2025 | $2,851 | $41,344 | $7,460 | $33,884 |
| 2024 | $2,851 | $41,344 | $7,460 | $33,884 |
| 2023 | $2,851 | $41,344 | $7,460 | $33,884 |
| 2022 | $2,851 | $41,344 | $7,460 | $33,884 |
| 2021 | $2,426 | $32,655 | $7,385 | $25,270 |
| 2020 | $2,426 | $32,655 | $7,385 | $25,270 |
| 2019 | $2,426 | $32,655 | $7,385 | $25,270 |
| 2018 | $2,344 | $31,554 | $7,136 | $24,418 |
| 2016 | $2,316 | $31,179 | $6,796 | $24,383 |
| 2015 | $2,316 | $29,698 | $6,473 | $23,225 |
| 2014 | $2,152 | $28,972 | $6,315 | $22,657 |
Source: Public Records
Map
Nearby Homes
- 95 Hampton St
- 88 Tower Ave
- 283 Martin St
- 139 Clark St Unit B
- 165 Martin St Unit 167
- 57 Love Ln
- 70 Ashford St
- 2404 Main St
- 58-60 Ashford St
- 147 Martin St
- 292 Enfield St Unit 294
- 35 Loomis St
- 14 Bennett Cir
- 275 Westland St
- 36 Capen St Unit 2B
- 33 Martin St
- 382 Vine St
- 472 Edgewood St Unit 474
- 431 Edgewood St Unit 433
- 300 Vine St Unit 302
Your Personal Tour Guide
Ask me questions while you tour the home.