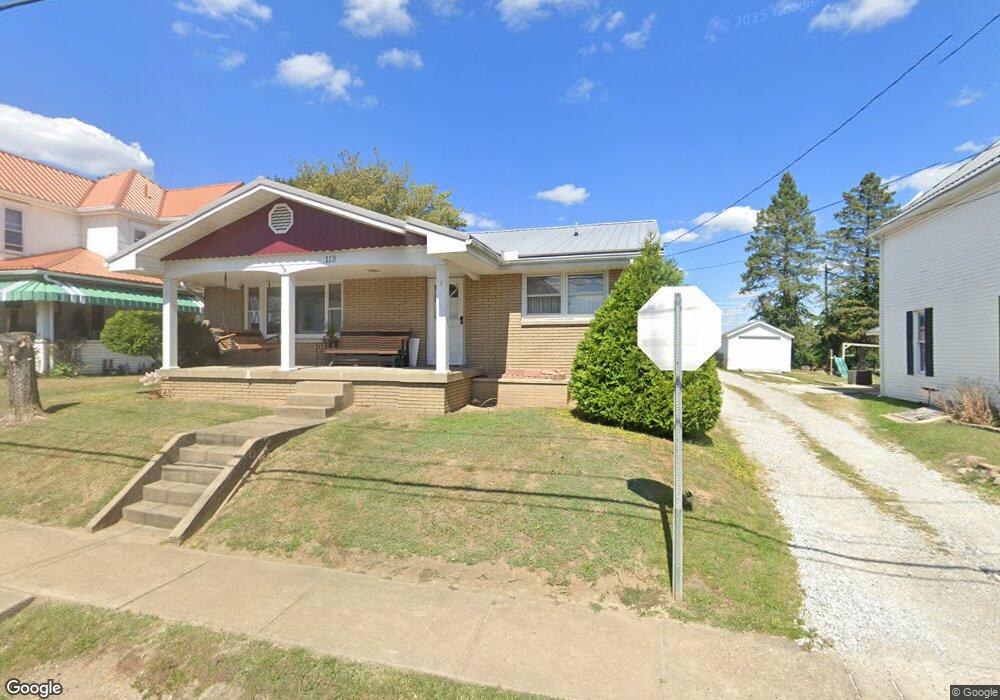
113 Maple Ave Bethesda, OH 43719
Estimated Value: $140,000 - $231,000
3
Beds
3
Baths
1,512
Sq Ft
$129/Sq Ft
Est. Value
About This Home
This home is located at 113 Maple Ave, Bethesda, OH 43719 and is currently estimated at $195,046, approximately $128 per square foot. 113 Maple Ave is a home located in Belmont County with nearby schools including Union Local Elementary School, Union Local Middle School, and Union Local High School.
Ownership History
Date
Name
Owned For
Owner Type
Purchase Details
Closed on
Feb 11, 2025
Sold by
Toohey Crystal D and Gregor Valerie L
Bought by
Barnhouse William D
Current Estimated Value
Purchase Details
Closed on
Jun 29, 2004
Sold by
Barnhouse Florence D
Bought by
Barnhouse Florence D
Purchase Details
Closed on
Jun 2, 1994
Sold by
Barnhouse William H and Barnhouse Flo
Bought by
Barnhouse William H and Barnhouse Flo
Purchase Details
Closed on
Jan 1, 1986
Sold by
Barnhouse William D Tru
Bought by
Barnhouse William D Tru
Create a Home Valuation Report for This Property
The Home Valuation Report is an in-depth analysis detailing your home's value as well as a comparison with similar homes in the area
Purchase History
| Date | Buyer | Sale Price | Title Company |
|---|---|---|---|
| Barnhouse William D | $80,000 | None Listed On Document | |
| Barnhouse William D | $80,000 | None Listed On Document | |
| Barnhouse Florence D | -- | -- | |
| Barnhouse William H | -- | -- | |
| Barnhouse William D Tru | -- | -- |
Source: Public Records
Tax History
| Year | Tax Paid | Tax Assessment Tax Assessment Total Assessment is a certain percentage of the fair market value that is determined by local assessors to be the total taxable value of land and additions on the property. | Land | Improvement |
|---|---|---|---|---|
| 2025 | $1,749 | $58,380 | $2,130 | $56,250 |
| 2024 | $1,735 | $58,380 | $2,130 | $56,250 |
| 2023 | $1,441 | $47,150 | $1,630 | $45,520 |
| 2022 | $1,457 | $47,152 | $1,631 | $45,521 |
| 2021 | $1,451 | $47,152 | $1,631 | $45,521 |
| 2020 | $1,296 | $41,020 | $1,420 | $39,600 |
| 2019 | $1,282 | $41,020 | $1,420 | $39,600 |
| 2018 | $1,249 | $41,020 | $1,420 | $39,600 |
| 2017 | $1,376 | $43,030 | $1,540 | $41,490 |
| 2016 | $1,380 | $43,030 | $1,540 | $41,490 |
| 2015 | $1,418 | $43,030 | $1,540 | $41,490 |
| 2014 | $1,263 | $39,120 | $1,400 | $37,720 |
| 2013 | $1,127 | $39,120 | $1,400 | $37,720 |
Source: Public Records
Map
Nearby Homes
- 121 Maple Ave
- 416 2nd St
- 409 2nd St
- 101 Willow St
- 204 Oak St
- 0 Judson St Unit 5197436
- 201 Pear Unit Lot23
- 201 Pear Unit LOT 31
- 201 Pear Unit 9
- 430 S Main St
- 63054 & 63060 S 26 Rd
- 0 Belmont Centerville Rd
- 220 Market St
- 66164 Belmont Morristown Rd
- 39991 National Rd
- 0 National Rd
- 408 W Main St
- 125 Chaplins Ln
- 38510 National Rd
- INLOT 19 Havenwood
Your Personal Tour Guide
Ask me questions while you tour the home.