Estimated Value: $122,346
Studio
1
Bath
2,000
Sq Ft
$61/Sq Ft
Est. Value
About This Home
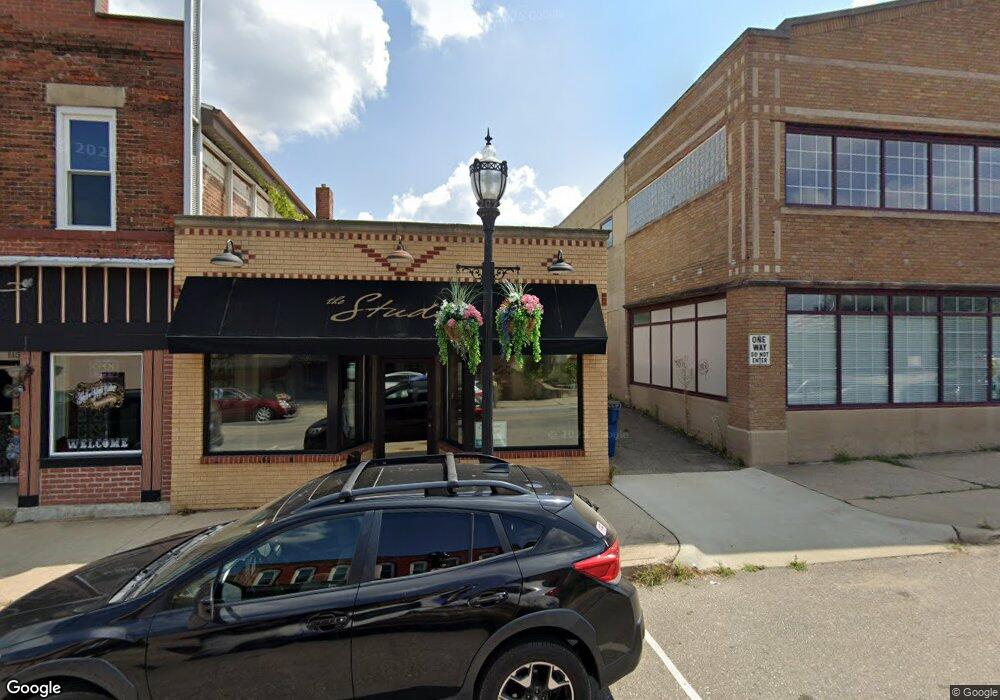
This home is located at 113 N 3rd St, Niles, MI 49120 and is currently estimated at $122,346, approximately $61 per square foot. 113 N 3rd St is a home located in Berrien County with nearby schools including Ballard Elementary School, Oak Manor Sixth Grade Center, and Ring Lardner Middle School.
Ownership History
Date
Name
Owned For
Owner Type
Purchase Details
Closed on
Dec 15, 2015
Sold by
Casperson Allen and Casperson Linda
Bought by
Sjf Properties Llc
Current Estimated Value
Purchase Details
Closed on
Mar 1, 2010
Sold by
Lippert Mike
Bought by
Casperson Allen and Casperson Linda
Home Financials for this Owner
Home Financials are based on the most recent Mortgage that was taken out on this home.
Original Mortgage
$30,000
Interest Rate
5.02%
Mortgage Type
Commercial
Purchase Details
Closed on
Feb 25, 2010
Sold by
Fershin Kenneth L and Calvano Pamela A
Bought by
Lippert Mike
Home Financials for this Owner
Home Financials are based on the most recent Mortgage that was taken out on this home.
Original Mortgage
$30,000
Interest Rate
5.02%
Mortgage Type
Commercial
Purchase Details
Closed on
Aug 9, 2007
Sold by
Fershin Kenneth Lee and Calvano Pamela Ann
Bought by
Lippert Mike
Purchase Details
Closed on
Jan 28, 2000
Purchase Details
Closed on
Dec 2, 1994
Purchase Details
Closed on
Dec 1, 1994
Purchase Details
Closed on
Nov 24, 1994
Purchase Details
Closed on
Nov 30, 1992
Create a Home Valuation Report for This Property
The Home Valuation Report is an in-depth analysis detailing your home's value as well as a comparison with similar homes in the area
Home Values in the Area
Average Home Value in this Area
Purchase History
We collect this data history from publicly available records. To have your information removed, we recommend requesting removal directly through your county’s website.
| Date | Buyer | Sale Price | Title Company |
|---|---|---|---|
| Sjf Properties Llc | $55,000 | First American Title | |
| Casperson Allen | -- | First American Title | |
| Lippert Mike | -- | Chicago Title | |
| Lippert Mike | $35,000 | None Available | |
| -- | $100 | -- | |
| -- | $25,000 | -- | |
| -- | $19,200 | -- | |
| -- | -- | -- | |
| -- | $19,200 | -- |
Source: Public Records
Mortgage History
We collect this data history from publicly available records. To have your information removed, we recommend requesting removal directly through your county’s website.
| Date | Status | Borrower | Loan Amount |
|---|---|---|---|
| Previous Owner | Casperson Allen | $30,000 |
Source: Public Records
Tax History
| Year | Tax Paid | Tax Assessment Tax Assessment Total Assessment is a certain percentage of the fair market value that is determined by local assessors to be the total taxable value of land and additions on the property. | Land | Improvement |
|---|---|---|---|---|
| 2025 | $1,520 | $44,800 | $0 | $0 |
| 2024 | $800 | $43,900 | $0 | $0 |
| 2023 | $767 | $39,600 | $0 | $0 |
| 2022 | $730 | $31,300 | $0 | $0 |
| 2021 | $1,331 | $28,200 | $1,200 | $27,000 |
| 2020 | $1,316 | $30,100 | $0 | $0 |
| 2019 | $1,297 | $22,300 | $1,300 | $21,000 |
| 2018 | $1,284 | $22,300 | $0 | $0 |
| 2017 | $1,312 | $23,200 | $0 | $0 |
| 2016 | $1,030 | $18,300 | $0 | $0 |
| 2015 | $710 | $12,500 | $0 | $0 |
| 2014 | $442 | $14,800 | $0 | $0 |
Source: Public Records
Map
Nearby Homes
Your Personal Tour Guide
Ask me questions while you tour the home.