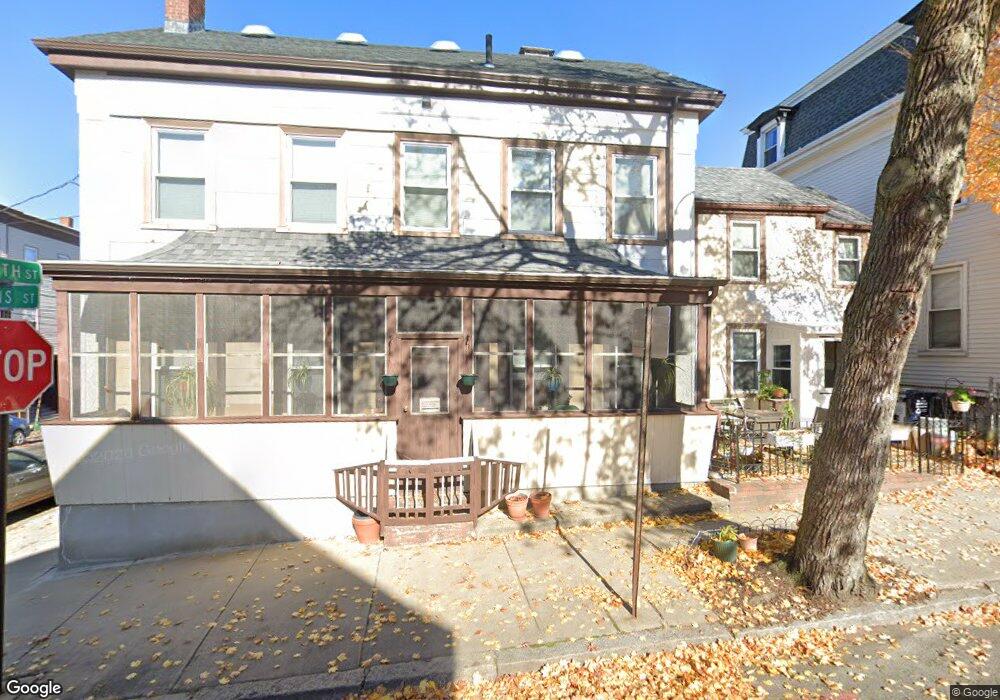
113 Otis St Cambridge, MA 02141
East Cambridge NeighborhoodEstimated Value: $1,458,868 - $2,291,000
4
Beds
2
Baths
1,965
Sq Ft
$896/Sq Ft
Est. Value
About This Home
This home is located at 113 Otis St, Cambridge, MA 02141 and is currently estimated at $1,760,967, approximately $896 per square foot. 113 Otis St is a home located in Middlesex County with nearby schools including Community Charter School of Cambridge and Torit Montessori School.
Ownership History
Date
Name
Owned For
Owner Type
Purchase Details
Closed on
Nov 13, 2025
Sold by
Mazzola Antonio P and Steinhilber Julie
Bought by
Antonio P Mazzola Ret and Mazzola
Current Estimated Value
Purchase Details
Closed on
Apr 25, 2024
Sold by
Dagostino Rossana M
Bought by
Mazzola Antonio and Steinhilber Julie
Create a Home Valuation Report for This Property
The Home Valuation Report is an in-depth analysis detailing your home's value as well as a comparison with similar homes in the area
Home Values in the Area
Average Home Value in this Area
Purchase History
We collect this data history from publicly available records. To have your information removed, we recommend requesting removal directly through your county’s website.
| Date | Buyer | Sale Price | Title Company |
|---|---|---|---|
| Antonio P Mazzola Ret | -- | -- | |
| Mazzola Antonio | $487,000 | None Available |
Source: Public Records
Tax History
| Year | Tax Paid | Tax Assessment Tax Assessment Total Assessment is a certain percentage of the fair market value that is determined by local assessors to be the total taxable value of land and additions on the property. | Land | Improvement |
|---|---|---|---|---|
| 2025 | $6,547 | $1,031,000 | $565,700 | $465,300 |
| 2024 | $6,273 | $1,059,600 | $614,300 | $445,300 |
| 2023 | $5,692 | $971,300 | $586,500 | $384,800 |
| 2022 | $5,575 | $941,700 | $601,300 | $340,400 |
| 2021 | $7,062 | $906,300 | $590,000 | $316,300 |
| 2020 | $5,147 | $895,200 | $595,600 | $299,600 |
| 2019 | $5,070 | $853,600 | $584,200 | $269,400 |
| 2018 | $4,610 | $732,900 | $484,500 | $248,400 |
| 2017 | $4,344 | $669,300 | $433,200 | $236,100 |
| 2016 | $3,951 | $565,300 | $339,100 | $226,200 |
| 2015 | $3,851 | $492,400 | $290,700 | $201,700 |
| 2014 | $3,553 | $424,000 | $225,100 | $198,900 |
Source: Public Records
Map
Nearby Homes
- 32 5th St Unit 1
- 104 Thorndike St Unit 1
- 104 Thorndike St Unit 2
- 138 Thorndike St
- 3 Mullins Ct Unit 3
- 75 Winter St
- 170 Gore St Unit 417
- 93 Third St
- 241 Hurley St Unit 1
- 47-53R 8th St
- 131 Charles St Unit R
- 51 Fulkerson St
- 30
- 71 Fulkerson St Unit 102
- 71 Fulkerson St Unit 309
- 30 2nd St Unit B
- 30 2nd St Unit A
- 213 Third St
- 57 Hurley St Unit 3
- 95 2nd St Unit 3
Your Personal Tour Guide
Ask me questions while you tour the home.