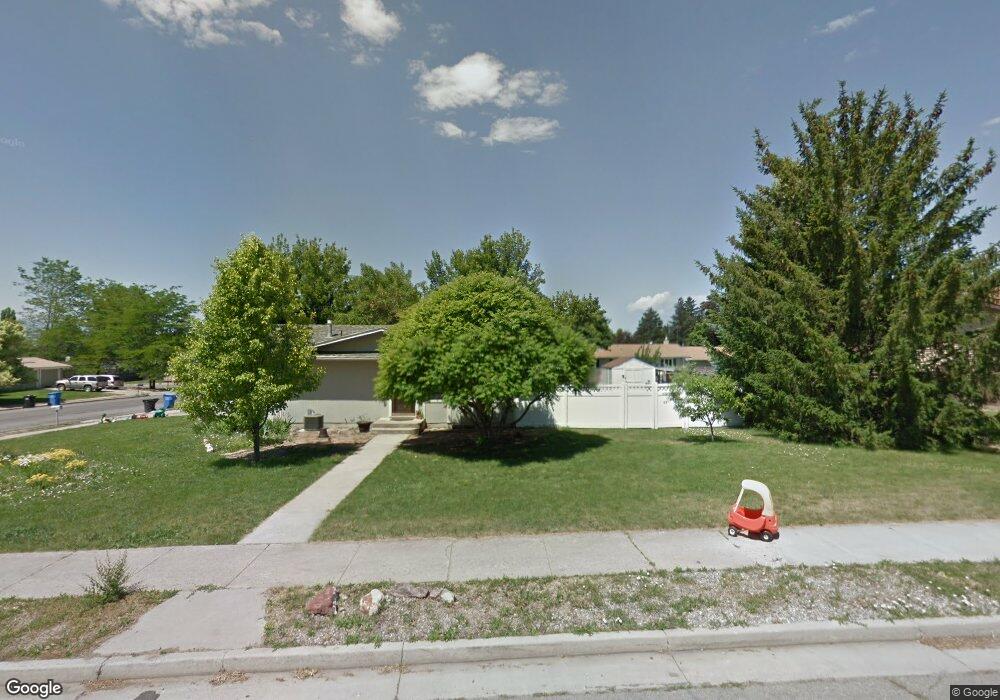
113 S 490 E Smithfield, UT 84335
Estimated Value: $365,616 - $403,000
Studio
--
Bath
1,008
Sq Ft
$388/Sq Ft
Est. Value
About This Home
This home is located at 113 S 490 E, Smithfield, UT 84335 and is currently estimated at $391,404, approximately $388 per square foot. 113 S 490 E is a home with nearby schools including Sunrise School, Cedar Ridge School, and North Cache Middle School.
Ownership History
Date
Name
Owned For
Owner Type
Purchase Details
Closed on
Oct 1, 2008
Sold by
Lloyd Kathleen K and Lloyd Paul
Bought by
Nielson Brent E and Nielson Emily C
Current Estimated Value
Home Financials for this Owner
Home Financials are based on the most recent Mortgage that was taken out on this home.
Original Mortgage
$157,140
Outstanding Balance
$103,210
Interest Rate
6.43%
Mortgage Type
FHA
Estimated Equity
$288,194
Create a Home Valuation Report for This Property
The Home Valuation Report is an in-depth analysis detailing your home's value as well as a comparison with similar homes in the area
Home Values in the Area
Average Home Value in this Area
Purchase History
| Date | Buyer | Sale Price | Title Company |
|---|---|---|---|
| Nielson Brent E | -- | Cache Title Company |
Source: Public Records
Mortgage History
| Date | Status | Borrower | Loan Amount |
|---|---|---|---|
| Open | Nielson Brent E | $157,140 |
Source: Public Records
Tax History
| Year | Tax Paid | Tax Assessment Tax Assessment Total Assessment is a certain percentage of the fair market value that is determined by local assessors to be the total taxable value of land and additions on the property. | Land | Improvement |
|---|---|---|---|---|
| 2025 | $146 | $194,860 | $0 | $0 |
| 2024 | $1,808 | $227,095 | $0 | $0 |
| 2023 | $1,887 | $224,160 | $0 | $0 |
| 2022 | $1,918 | $224,160 | $0 | $0 |
| 2021 | $1,435 | $256,120 | $70,000 | $186,120 |
| 2020 | $1,352 | $225,100 | $70,000 | $155,100 |
| 2019 | $1,105 | $175,419 | $50,000 | $125,419 |
| 2018 | $1,018 | $156,288 | $50,000 | $106,288 |
| 2017 | $950 | $79,695 | $0 | $0 |
| 2016 | $967 | $79,695 | $0 | $0 |
| 2015 | $971 | $79,695 | $0 | $0 |
| 2014 | $819 | $68,575 | $0 | $0 |
| 2013 | -- | $68,575 | $0 | $0 |
Source: Public Records
Map
Nearby Homes
Your Personal Tour Guide
Ask me questions while you tour the home.