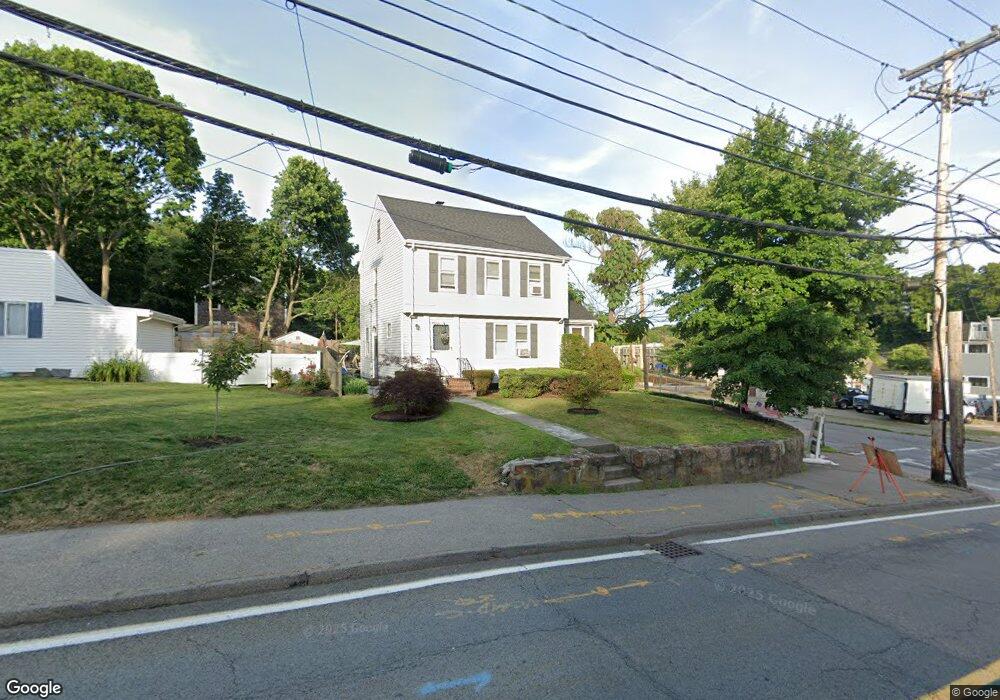
113 Shaw St Braintree, MA 02184
East Braintree NeighborhoodEstimated Value: $582,000 - $629,000
3
Beds
1
Bath
1,666
Sq Ft
$363/Sq Ft
Est. Value
About This Home
This home is located at 113 Shaw St, Braintree, MA 02184 and is currently estimated at $604,909, approximately $363 per square foot. 113 Shaw St is a home located in Norfolk County with nearby schools including Braintree High School, Sacred Heart Elementary School, and South Shore Christian Academy.
Ownership History
Date
Name
Owned For
Owner Type
Purchase Details
Closed on
Nov 8, 1979
Bought by
Mcadams Paul W
Current Estimated Value
Create a Home Valuation Report for This Property
The Home Valuation Report is an in-depth analysis detailing your home's value as well as a comparison with similar homes in the area
Home Values in the Area
Average Home Value in this Area
Purchase History
We collect this data history from publicly available records. To have your information removed, we recommend requesting removal directly through your county’s website.
| Date | Buyer | Sale Price | Title Company |
|---|---|---|---|
| Mcadams Paul W | -- | -- |
Source: Public Records
Mortgage History
We collect this data history from publicly available records. To have your information removed, we recommend requesting removal directly through your county’s website.
| Date | Status | Borrower | Loan Amount |
|---|---|---|---|
| Open | Mcadams Paul W | $105,000 | |
| Closed | Mcadams Paul W | $25,000 | |
| Closed | Mcadams Paul W | $81,000 |
Source: Public Records
Tax History
| Year | Tax Paid | Tax Assessment Tax Assessment Total Assessment is a certain percentage of the fair market value that is determined by local assessors to be the total taxable value of land and additions on the property. | Land | Improvement |
|---|---|---|---|---|
| 2025 | $5,321 | $533,200 | $283,000 | $250,200 |
| 2024 | $4,767 | $502,900 | $261,500 | $241,400 |
| 2023 | $4,566 | $467,800 | $240,100 | $227,700 |
| 2022 | $4,484 | $450,700 | $223,000 | $227,700 |
| 2021 | $4,176 | $419,700 | $205,800 | $213,900 |
| 2020 | $4,138 | $419,700 | $205,800 | $213,900 |
| 2019 | $3,999 | $396,300 | $205,800 | $190,500 |
| 2018 | $3,636 | $345,000 | $162,900 | $182,100 |
| 2017 | $3,434 | $319,700 | $145,800 | $173,900 |
| 2016 | $3,201 | $291,500 | $128,600 | $162,900 |
| 2015 | $3,094 | $279,500 | $123,500 | $156,000 |
| 2014 | $3,050 | $267,100 | $123,500 | $143,600 |
Source: Public Records
Map
Nearby Homes
- 37 Lantern Ln
- 16 Cotton Ave
- 51 Faxon St
- 49 Brookside Rd
- 296 Commercial St Unit 21
- 302 Commercial St Unit 21
- 37 Tingley Rd
- 25 Fairmount Ave
- 12 Marietta Ave
- 146 Hayward St
- 24 Hillside Ave
- 67 Trefton Dr
- 12 Franklin St
- 115 Pilgrim Rd
- 38 Stonewood Ln
- 30 Skyline Dr Unit 6
- 48 Summer St
- 37 Skyline Dr Unit 11
- 11 Roseen Ave
- 15 Devon Rd
- 121 Allen St
- 125 Allen St Unit B
- 125 Allen St Unit 1
- 125 Allen St Unit 2
- 125 Allen St
- 136 Shaw St Unit 2
- 136 Shaw St Unit 1
- 127 Allen St
- 140 Shaw St
- 119 Shaw St
- 137 Allen St
- 19A Sheppard Ave
- 137 Shaw St
- 138 Allen St Unit 1
- 19 Sheppard Ave
- 134 Allen St Unit 136
- 142 Shaw St
- 141 Allen St
- 141 Allen St
- 99 Shaw St
Your Personal Tour Guide
Ask me questions while you tour the home.