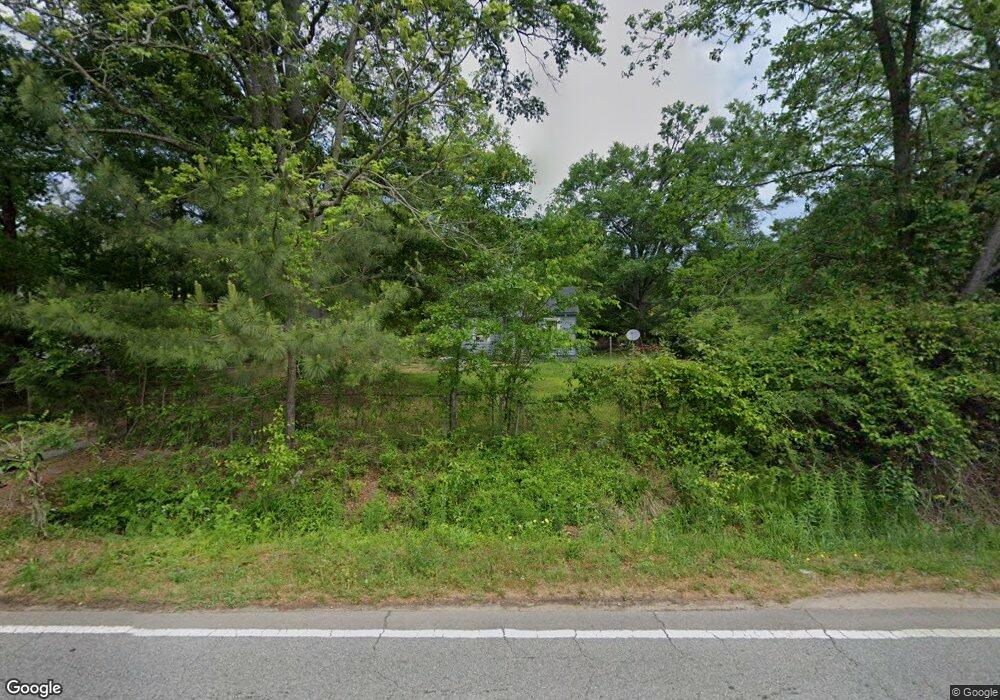
113 Vineyard Rd Griffin, GA 30223
Spalding County NeighborhoodEstimated Value: $68,000 - $172,000
2
Beds
1
Bath
729
Sq Ft
$163/Sq Ft
Est. Value
About This Home
This home is located at 113 Vineyard Rd, Griffin, GA 30223 and is currently estimated at $118,891, approximately $163 per square foot. 113 Vineyard Rd is a home located in Spalding County with nearby schools including Cowan Road Elementary School, Cowan Road Middle School, and Griffin High School.
Ownership History
Date
Name
Owned For
Owner Type
Purchase Details
Closed on
Sep 9, 1983
Sold by
Blackwell Charles R
Bought by
Pace Kenneth D and Mary Jane
Current Estimated Value
Purchase Details
Closed on
Aug 8, 1977
Sold by
Smith Alicia C
Bought by
Blackwell Charles R
Purchase Details
Closed on
Aug 14, 1975
Sold by
Passmore J B
Bought by
Singletary Horace K
Purchase Details
Closed on
Jun 1, 1975
Sold by
Singletary Horace K
Bought by
Smith Alicia C
Purchase Details
Closed on
Sep 17, 1956
Bought by
Passmore J B
Create a Home Valuation Report for This Property
The Home Valuation Report is an in-depth analysis detailing your home's value as well as a comparison with similar homes in the area
Home Values in the Area
Average Home Value in this Area
Purchase History
| Date | Buyer | Sale Price | Title Company |
|---|---|---|---|
| Pace Kenneth D | -- | -- | |
| Blackwell Charles R | $22,000 | -- | |
| Singletary Horace K | $15,000 | -- | |
| Smith Alicia C | -- | -- | |
| Passmore J B | -- | -- |
Source: Public Records
Tax History
| Year | Tax Paid | Tax Assessment Tax Assessment Total Assessment is a certain percentage of the fair market value that is determined by local assessors to be the total taxable value of land and additions on the property. | Land | Improvement |
|---|---|---|---|---|
| 2025 | $578 | $16,158 | $7,200 | $8,958 |
| 2024 | $572 | $16,158 | $7,200 | $8,958 |
| 2023 | $600 | $16,509 | $7,200 | $9,309 |
| 2022 | $564 | $15,509 | $7,200 | $8,309 |
| 2021 | $440 | $12,112 | $4,800 | $7,312 |
| 2020 | $413 | $11,327 | $4,800 | $6,527 |
| 2019 | $422 | $11,327 | $4,800 | $6,527 |
| 2018 | $409 | $10,709 | $4,800 | $5,909 |
| 2017 | $381 | $10,260 | $4,800 | $5,460 |
| 2016 | $388 | $10,260 | $4,800 | $5,460 |
| 2015 | $400 | $10,260 | $4,800 | $5,460 |
| 2014 | $408 | $10,260 | $4,800 | $5,460 |
Source: Public Records
Map
Nearby Homes
- 2547 Old Atlanta Rd
- 2407 Old Atlanta Rd
- 205 Westmoreland Dr
- 117 Dobbins Mill Rd
- 310 Sunset Dr
- 523 Vineyard Rd
- 203 Plantation Trail
- 205 Sport Way
- 206 Sport Way
- 1206 Chardonnay Ln
- 1157 Burgundy Dr
- 1131 Burgundy Dr
- 1148 Burgundy Dr
- 1374 (0) Kilgore Rd
- 515 Alder Lane Ct
- 410 Teamon Pointe Dr
- 207 Ravenna Ct
- 408 Teamon Pointe Dr
- 511 Alder Lane Ct
- 406 Teamon Pointe Dr
- 109 Vineyard Rd
- 118 Vineyard Rd
- 116 Vineyard Rd
- 107 Vineyard Rd
- 114 Vineyard Rd
- 112 Vineyard Rd
- 122 Manley Dr
- 128 Manley Dr
- 130 Manley Dr
- 105 Vineyard Rd
- 134 Manley Dr
- 120 Manley Dr
- 138 Manley Dr
- 128 Vineyard Rd
- 110 Vineyard Rd
- 103 Vineyard Rd
- 112 Manley Dr
- 129 Vineyard Rd
- 120 Vineyard Rd
- 110 Manley Dr
Your Personal Tour Guide
Ask me questions while you tour the home.