1130 Grape St Denver, CO 80220
Hale NeighborhoodEstimated Value: $683,630 - $860,000
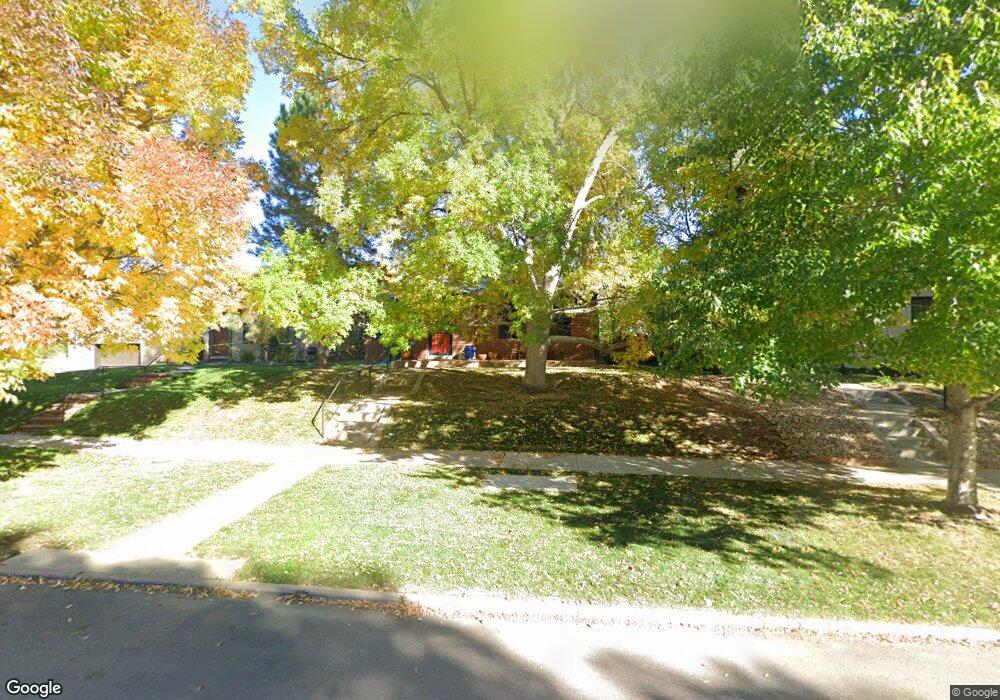
About This Home
This home is located at 1130 Grape St, Denver, CO 80220 and is currently estimated at $740,408, approximately $532 per square foot. 1130 Grape St is a home located in Denver County with nearby schools including Palmer Elementary School, Hill Campus of Arts & Sciences, and George Washington High School.
Ownership History
We collect this data history from publicly available records. To have your information removed, we recommend requesting removal directly through your county’s website.
Purchase Details
Home Values in the Area
Average Home Value in this Area
Purchase History
We collect this data history from publicly available records. To have your information removed, we recommend requesting removal directly through your county’s website.
| Date | Buyer | Sale Price | Title Company |
|---|---|---|---|
| -- | Land Title |
Mortgage History
We collect this data history from publicly available records. To have your information removed, we recommend requesting removal directly through your county’s website.
| Date | Status | Borrower | Loan Amount |
|---|---|---|---|
| Open | $495,000 | ||
| Closed | $250,000 | ||
| Closed | $53,000 | ||
| Closed | $260,000 | ||
| Open | $1,500,000 | ||
| Closed | $750,000 | ||
| Closed | $128,000 | ||
| Closed | $130,000 | ||
| Closed | $50,000 |
Tax History
We collect this data history from publicly available records. To have your information removed, we recommend requesting removal directly through your county’s website.
| Year | Tax Paid | Tax Assessment Tax Assessment Total Assessment is a certain percentage of the fair market value that is determined by local assessors to be the total taxable value of land and additions on the property. | Land | Improvement |
|---|---|---|---|---|
| 2025 | $3,531 | $53,210 | $37,600 | $37,600 |
| 2024 | $3,382 | $49,400 | $30,060 | $19,340 |
| 2023 | $3,309 | $49,400 | $30,060 | $19,340 |
| 2022 | $2,787 | $41,990 | $24,710 | $17,280 |
| 2021 | $2,690 | $43,200 | $25,420 | $17,780 |
| 2020 | $2,529 | $41,240 | $25,420 | $15,820 |
| 2019 | $2,458 | $41,240 | $25,420 | $15,820 |
| 2018 | $2,323 | $37,220 | $19,200 | $18,020 |
| 2017 | $2,316 | $37,220 | $19,200 | $18,020 |
| 2016 | $2,066 | $33,290 | $18,865 | $14,425 |
| 2015 | $1,979 | $33,290 | $18,865 | $14,425 |
| 2014 | $2,266 | $27,280 | $9,433 | $17,847 |
Map
- 790 Grape St
- 1200 Hudson St
- 987 Glencoe St
- 1124 Holly St
- 1248 Hudson St
- 1150 Ivanhoe St
- 780 Grape St
- 1274 Hudson St
- 906 Forest St
- 897 Glencoe St Unit 4
- 891 Glencoe St Unit 5
- 865 Grape St
- 1286 Forest St
- 857 Grape St
- 1075 Jersey St
- 1295 Forest St
- 1265 Ivy St
- 944 Ivanhoe St
- 1345 Grape St
- 1100 Jersey St
Ask me questions while you tour the home.