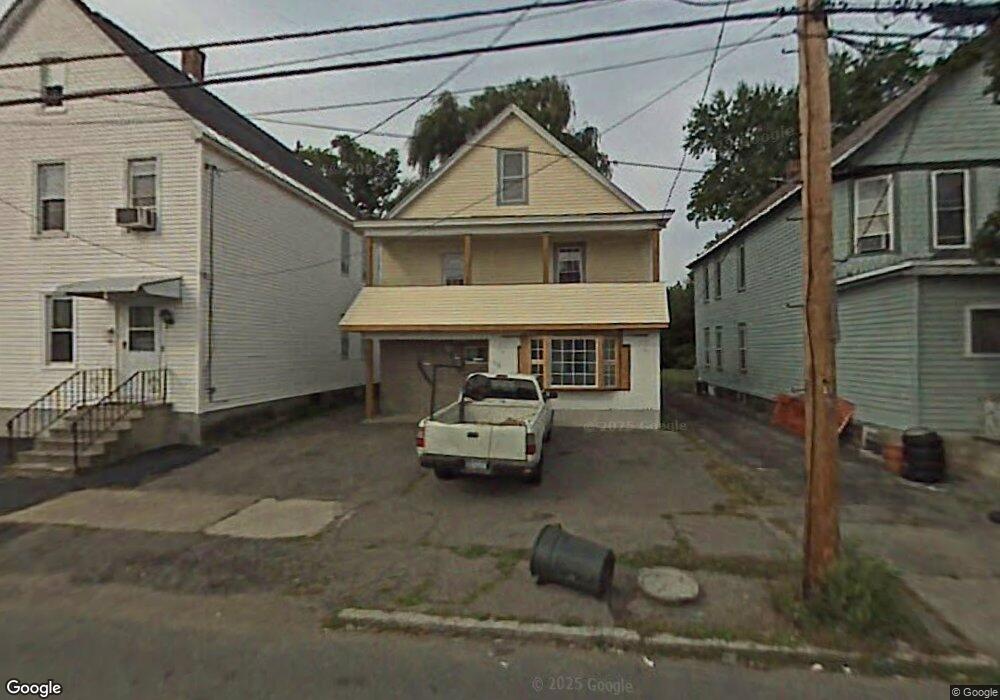
1130 Webster St Schenectady, NY 12303
Mont Pleasant NeighborhoodEstimated Value: $159,579 - $211,000
4
Beds
2
Baths
1,500
Sq Ft
$124/Sq Ft
Est. Value
About This Home
This home is located at 1130 Webster St, Schenectady, NY 12303 and is currently estimated at $185,895, approximately $123 per square foot. 1130 Webster St is a home located in Schenectady County with nearby schools including Hamilton Elementary School, Mont Pleasant Middle School, and Schenectady High School.
Ownership History
Date
Name
Owned For
Owner Type
Purchase Details
Closed on
Dec 9, 2021
Sold by
Fabio Urbano
Bought by
Samaroo Sundarram
Current Estimated Value
Purchase Details
Closed on
Jun 16, 2011
Sold by
Reoco Llc
Bought by
Thakurdyal Vidyawattie
Home Financials for this Owner
Home Financials are based on the most recent Mortgage that was taken out on this home.
Original Mortgage
$60,428
Interest Rate
4.75%
Mortgage Type
FHA
Purchase Details
Closed on
Feb 17, 2011
Sold by
Ali Farook
Bought by
Reoco Llc
Purchase Details
Closed on
Feb 21, 2007
Sold by
Mohabir Totaram
Bought by
Ali Farook
Purchase Details
Closed on
Jul 12, 2002
Sold by
Sec Of Hud
Bought by
Mohabir Totaram
Purchase Details
Closed on
Jul 11, 2001
Create a Home Valuation Report for This Property
The Home Valuation Report is an in-depth analysis detailing your home's value as well as a comparison with similar homes in the area
Home Values in the Area
Average Home Value in this Area
Purchase History
| Date | Buyer | Sale Price | Title Company |
|---|---|---|---|
| Samaroo Sundarram | $138,500 | Stewart Title | |
| Samaroo Sundarram | $138,500 | Stewart Title | |
| Thakurdyal Vidyawattie | $62,000 | None Available | |
| Reoco Llc | $1,000 | None Available | |
| Ali Farook | $19,000 | Nan Bedesi | |
| Mohabir Totaram | $24,000 | -- | |
| -- | $61,239 | -- |
Source: Public Records
Mortgage History
| Date | Status | Borrower | Loan Amount |
|---|---|---|---|
| Previous Owner | Thakurdyal Vidyawattie | $60,428 |
Source: Public Records
Tax History
| Year | Tax Paid | Tax Assessment Tax Assessment Total Assessment is a certain percentage of the fair market value that is determined by local assessors to be the total taxable value of land and additions on the property. | Land | Improvement |
|---|---|---|---|---|
| 2024 | $3,486 | $71,100 | $10,700 | $60,400 |
| 2023 | $34 | $71,100 | $10,700 | $60,400 |
| 2022 | $3,224 | $71,100 | $10,700 | $60,400 |
| 2021 | $3,142 | $71,100 | $10,700 | $60,400 |
| 2020 | $2,922 | $71,100 | $10,700 | $60,400 |
| 2019 | $2,101 | $71,100 | $10,700 | $60,400 |
| 2018 | $2,889 | $71,100 | $10,700 | $60,400 |
| 2017 | $2,620 | $71,100 | $10,700 | $60,400 |
| 2016 | $3,015 | $71,100 | $10,700 | $60,400 |
| 2015 | -- | $71,100 | $10,700 | $60,400 |
| 2014 | -- | $71,100 | $10,700 | $60,400 |
Source: Public Records
Map
Nearby Homes
Your Personal Tour Guide
Ask me questions while you tour the home.