
Seller's Agent in 2012
Sam Habib
CENTURY 21 Masters
(408) 234-1500
19 Total Sales
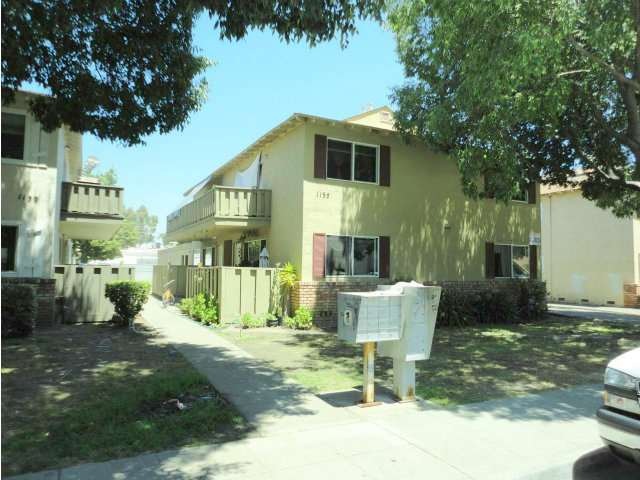
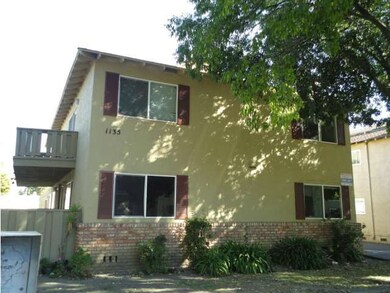
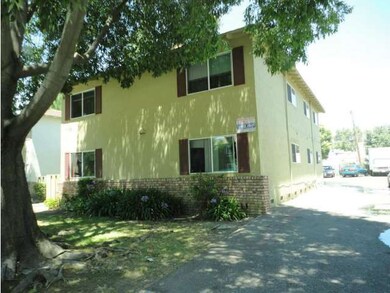
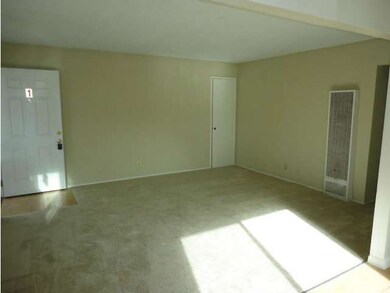
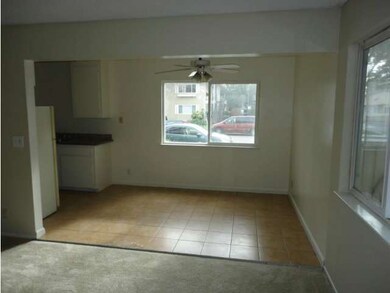
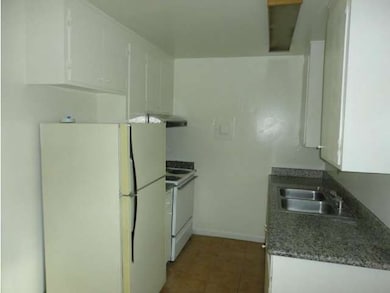
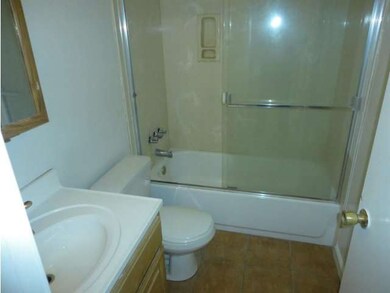
Great Investment property* Well maintained * Located in a quiet and desirable Sunnyvale Neighborhood * All units are in good conditions * Granite Counter Top in all units *Good School District * Easy access to Hwy 237, Hwy 85 and Central Expressway * Close to Schools , Stores and Major Shopping Centers *
Last Agent to Sell the Property
CENTURY 21 Masters License #01253784 Listed on: 01/27/2012
Last Buyer's Agent
Anoosh Sardariani
CENTURY 21 Masters License #01478924
We collect this data history from publicly available records. To have your information removed, we recommend requesting removal directly through your county’s website.
| Date | Event | Price | List to Sale | Price per Sq Ft |
|---|---|---|---|---|
| 04/05/2012 04/05/12 | Sold | $717,500 | +1.5% | $234 / Sq Ft |
| 02/06/2012 02/06/12 | Pending | -- | -- | -- |
| 01/27/2012 01/27/12 | For Sale | $706,800 | -- | $230 / Sq Ft |
We collect this data history from publicly available records. To have your information removed, we recommend requesting removal directly through your county’s website.
| Year | Tax Paid | Tax Assessment Tax Assessment Total Assessment is a certain percentage of the fair market value that is determined by local assessors to be the total taxable value of land and additions on the property. | Land | Improvement |
|---|---|---|---|---|
| 2025 | $10,470 | $901,209 | $612,323 | $288,886 |
| 2024 | $10,470 | $883,539 | $600,317 | $283,222 |
| 2023 | $10,374 | $866,216 | $588,547 | $277,669 |
| 2022 | $10,213 | $849,232 | $577,007 | $272,225 |
| 2021 | $10,117 | $832,582 | $565,694 | $266,888 |
| 2020 | $9,990 | $824,046 | $559,894 | $264,152 |
| 2019 | $9,769 | $807,889 | $548,916 | $258,973 |
| 2018 | $9,576 | $792,049 | $538,153 | $253,896 |
| 2017 | $9,453 | $776,519 | $527,601 | $248,918 |
| 2016 | $9,088 | $761,294 | $517,256 | $244,038 |
| 2015 | $9,140 | $749,860 | $509,487 | $240,373 |
| 2014 | -- | $735,172 | $499,507 | $235,665 |
Seller's Agent in 2012
Sam Habib
CENTURY 21 Masters
(408) 234-1500
19 Total Sales
A
Buyer's Agent in 2012
Anoosh Sardariani
CENTURY 21 Masters
Source: MLSListings
MLS Number: ML81203229
APN: 161-31-006
Disclaimer: Certain information contained herein is derived from information provided by parties other than Homes.com. All information provided is deemed reliable, but is not guaranteed to be accurate and should be independently verified.
![]() Property Information © 2026 MLSListings Inc. All rights reserved. Listing information is deemed reliable but not guaranteed. Certain information contained herein is derived from information which is the licensed property of, and copyrighted by, MLSListings Inc. The viewer acknowledges ownership and validity of its copyright. Information provided is for personal, non-commercial use by a viewer with a bona fide interest in the purchase or sale of real estate of the type being offered via this website or other electronic means. The viewer is prohibited from copying, redistributing or retransmitting any of the data or information provided by MLSListing, Inc.
Property Information © 2026 MLSListings Inc. All rights reserved. Listing information is deemed reliable but not guaranteed. Certain information contained herein is derived from information which is the licensed property of, and copyrighted by, MLSListings Inc. The viewer acknowledges ownership and validity of its copyright. Information provided is for personal, non-commercial use by a viewer with a bona fide interest in the purchase or sale of real estate of the type being offered via this website or other electronic means. The viewer is prohibited from copying, redistributing or retransmitting any of the data or information provided by MLSListing, Inc.
Ask me questions while you tour the home.