Estimated Value: $112,581 - $155,000
3
Beds
1
Bath
912
Sq Ft
$147/Sq Ft
Est. Value
About This Home
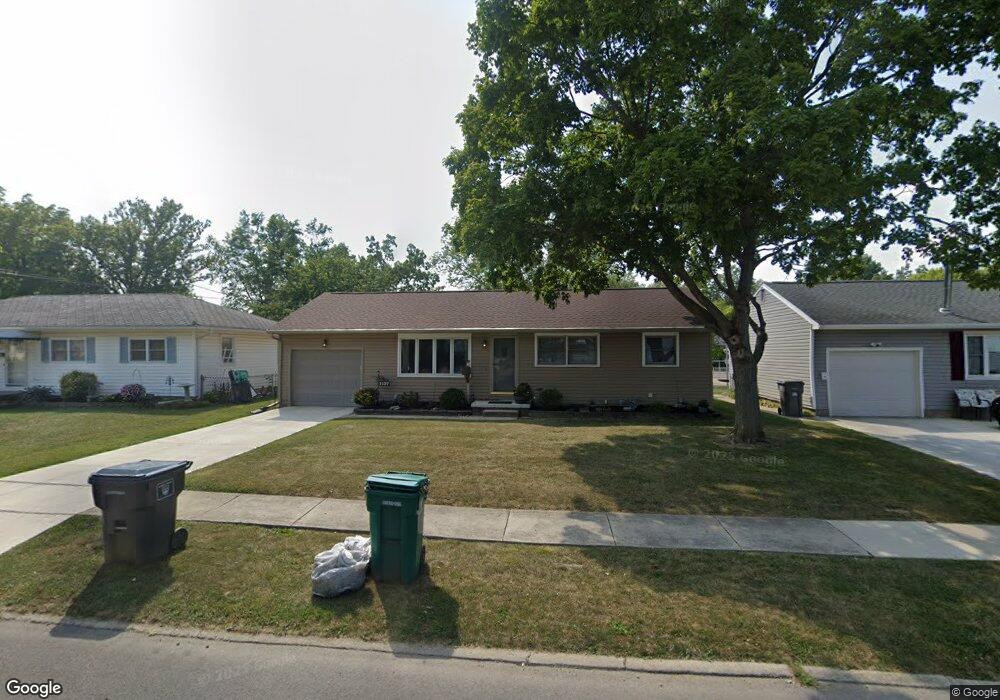
This home is located at 1137 Melrose St, Lima, OH 45801 and is currently estimated at $133,895, approximately $146 per square foot. 1137 Melrose St is a home located in Allen County with nearby schools including Heritage Elementary School, Lima North Middle School, and Lima West Middle School.
Ownership History
Date
Name
Owned For
Owner Type
Purchase Details
Closed on
Jun 25, 2001
Sold by
Prigge Mary A
Bought by
Garlock Lisa F
Current Estimated Value
Home Financials for this Owner
Home Financials are based on the most recent Mortgage that was taken out on this home.
Original Mortgage
$65,863
Interest Rate
7.11%
Mortgage Type
New Conventional
Purchase Details
Closed on
Aug 1, 1978
Bought by
Prigge Mary Ann
Create a Home Valuation Report for This Property
The Home Valuation Report is an in-depth analysis detailing your home's value as well as a comparison with similar homes in the area
Purchase History
We collect this data history from publicly available records. To have your information removed, we recommend requesting removal directly through your county’s website.
| Date | Buyer | Sale Price | Title Company |
|---|---|---|---|
| Garlock Lisa F | $67,900 | -- | |
| Prigge Mary Ann | $36,000 | -- |
Source: Public Records
Mortgage History
We collect this data history from publicly available records. To have your information removed, we recommend requesting removal directly through your county’s website.
| Date | Status | Borrower | Loan Amount |
|---|---|---|---|
| Previous Owner | Garlock Lisa F | $65,863 |
Source: Public Records
Tax History
| Year | Tax Paid | Tax Assessment Tax Assessment Total Assessment is a certain percentage of the fair market value that is determined by local assessors to be the total taxable value of land and additions on the property. | Land | Improvement |
|---|---|---|---|---|
| 2025 | $1,105 | $30,180 | $5,220 | $24,960 |
| 2024 | $1,104 | $30,180 | $5,220 | $24,960 |
| 2023 | $877 | $20,410 | $3,540 | $16,870 |
| 2022 | $881 | $20,410 | $3,540 | $16,870 |
| 2021 | $930 | $20,410 | $3,540 | $16,870 |
| 2020 | $938 | $18,310 | $3,430 | $14,880 |
| 2019 | $938 | $18,310 | $3,430 | $14,880 |
| 2018 | $930 | $18,310 | $3,430 | $14,880 |
| 2017 | $872 | $16,840 | $3,430 | $13,410 |
| 2016 | $878 | $16,840 | $3,430 | $13,410 |
| 2015 | $897 | $16,840 | $3,430 | $13,410 |
| 2014 | $963 | $18,410 | $3,290 | $15,120 |
| 2013 | $937 | $18,410 | $3,290 | $15,120 |
Source: Public Records
Map
Nearby Homes
- 777 Ewing Ave
- 1101 Belvidere Ave
- 1118 N Baxter St
- 1015 N Cole St
- 0 Latham
- 576 W Grand Ave
- 841 N Baxter St
- 813 College Ave
- 1023 Leland Ave
- 949 Leland Ave
- 816 N Baxter St
- 623 Hazel Ave
- 576 W Ashton Ave
- 716 Ruth Ave
- 1580 W Robb Ave
- 557 W Ashton Ave
- 711 College Ave
- 953 Rice Ave
- 703 N Collett St
- 625 N Charles St
- 1000 Logan Ave
- 1001 Sherman Ave
- 1149 Melrose St
- 1010 Logan Ave
- 1145 Melrose St
- 1201 Melrose St
- 1003 Logan Ave
- 1001 Logan Ave
- 1141 Melrose St
- 1005 Logan Ave
- 1205 Melrose St
- 000 Sherman Ave E Logan
- 000 Sherman Ave E & Logan
- 1011 Logan Ave
- 1013 Sherman Ave
- 1209 Melrose St
- 1133 Melrose St
- 1017 Sherman Ave
- 1213 Melrose St
- 1006 Russell Ave
Your Personal Tour Guide
Ask me questions while you tour the home.