Estimated Value: $173,000 - $243,407
5
Beds
2
Baths
3,077
Sq Ft
$68/Sq Ft
Est. Value
About This Home
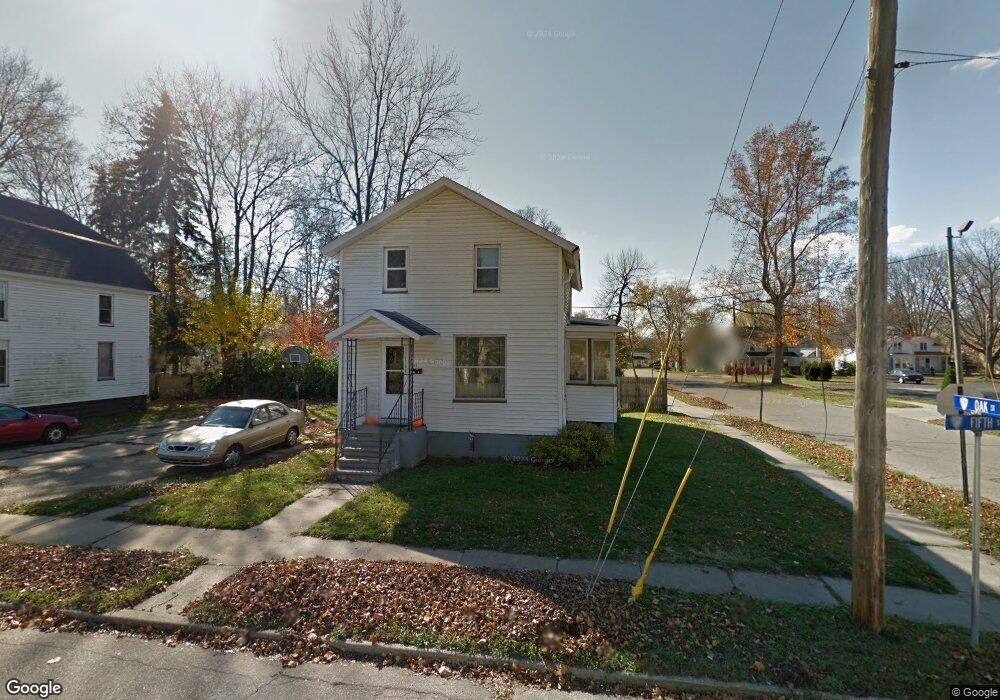
This home is located at 114 S 5th St, Niles, MI 49120 and is currently estimated at $210,352, approximately $68 per square foot. 114 S 5th St is a home located in Berrien County with nearby schools including Ballard Elementary School, Oak Manor Sixth Grade Center, and Ring Lardner Middle School.
Ownership History
Date
Name
Owned For
Owner Type
Purchase Details
Closed on
Feb 21, 2017
Sold by
Moore Richard P and Moore Kathleen M
Bought by
Moore Richard P and Moore Kathleen M
Current Estimated Value
Purchase Details
Closed on
Oct 31, 2006
Sold by
Moore Dorothy E and Moore Richard P
Bought by
Moore Dorothy E and Moore Richard P
Purchase Details
Closed on
Aug 4, 2003
Sold by
Moore Richard J and Moore Dorothy E
Bought by
Moore Richard J and Moore Dorothy E
Purchase Details
Closed on
Oct 4, 1988
Purchase Details
Closed on
Jun 1, 1983
Purchase Details
Closed on
Dec 7, 1979
Purchase Details
Closed on
Mar 23, 1978
Create a Home Valuation Report for This Property
The Home Valuation Report is an in-depth analysis detailing your home's value as well as a comparison with similar homes in the area
Home Values in the Area
Average Home Value in this Area
Purchase History
| Date | Buyer | Sale Price | Title Company |
|---|---|---|---|
| Moore Richard P | -- | Attorney | |
| Moore Dorothy E | -- | None Available | |
| Moore Dorothy E | -- | None Available | |
| Moore Richard J | -- | Chicago Title | |
| -- | $20,000 | -- | |
| -- | $101,200 | -- | |
| -- | -- | -- | |
| -- | -- | -- |
Source: Public Records
Tax History
| Year | Tax Paid | Tax Assessment Tax Assessment Total Assessment is a certain percentage of the fair market value that is determined by local assessors to be the total taxable value of land and additions on the property. | Land | Improvement |
|---|---|---|---|---|
| 2025 | $2,262 | $118,500 | $0 | $0 |
| 2024 | $1,179 | $109,400 | $0 | $0 |
| 2023 | $1,131 | $74,100 | $0 | $0 |
| 2022 | $1,077 | $68,300 | $0 | $0 |
| 2021 | $1,973 | $63,600 | $6,700 | $56,900 |
| 2020 | $1,950 | $48,700 | $0 | $0 |
| 2019 | $1,923 | $51,600 | $18,200 | $33,400 |
Source: Public Records
Map
Nearby Homes
Your Personal Tour Guide
Ask me questions while you tour the home.