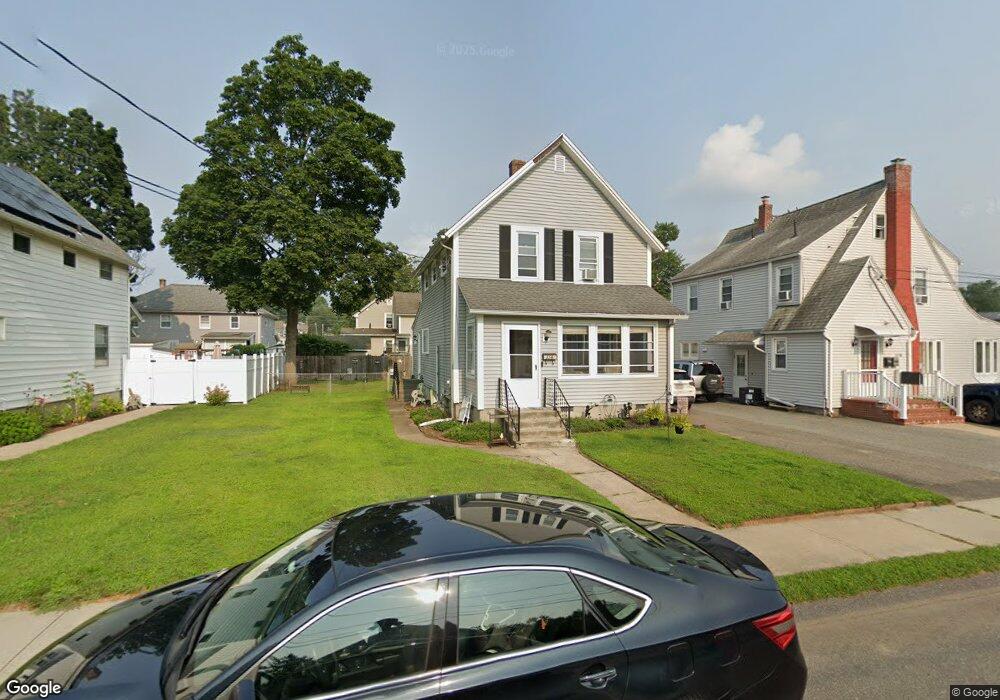
114 Whitney St Ludlow, MA 01056
Estimated Value: $283,000 - $299,000
4
Beds
1
Bath
1,441
Sq Ft
$201/Sq Ft
Est. Value
About This Home
This home is located at 114 Whitney St, Ludlow, MA 01056 and is currently estimated at $289,514, approximately $200 per square foot. 114 Whitney St is a home located in Hampden County with nearby schools including East Street Elementary School, Chapin Street Elementary School, and Paul R. Baird Middle School.
Ownership History
Date
Name
Owned For
Owner Type
Purchase Details
Closed on
Jun 23, 2000
Sold by
Bourbeau Bernadette
Bought by
Johnson Sean D and Johnson Maria D
Current Estimated Value
Home Financials for this Owner
Home Financials are based on the most recent Mortgage that was taken out on this home.
Original Mortgage
$95,000
Interest Rate
8.48%
Mortgage Type
Purchase Money Mortgage
Create a Home Valuation Report for This Property
The Home Valuation Report is an in-depth analysis detailing your home's value as well as a comparison with similar homes in the area
Home Values in the Area
Average Home Value in this Area
Purchase History
| Date | Buyer | Sale Price | Title Company |
|---|---|---|---|
| Johnson Sean D | $100,000 | -- | |
| Johnson Sean D | $100,000 | -- |
Source: Public Records
Mortgage History
| Date | Status | Borrower | Loan Amount |
|---|---|---|---|
| Open | Johnson Sean D | $125,600 | |
| Closed | Johnson Sean D | $125,600 | |
| Closed | Johnson Sean D | $95,000 |
Source: Public Records
Tax History
| Year | Tax Paid | Tax Assessment Tax Assessment Total Assessment is a certain percentage of the fair market value that is determined by local assessors to be the total taxable value of land and additions on the property. | Land | Improvement |
|---|---|---|---|---|
| 2025 | $3,683 | $212,300 | $71,100 | $141,200 |
| 2024 | $3,549 | $196,200 | $71,100 | $125,100 |
| 2023 | $3,367 | $172,600 | $62,400 | $110,200 |
| 2022 | $3,222 | $161,200 | $62,400 | $98,800 |
| 2021 | $3,244 | $153,900 | $62,400 | $91,500 |
| 2020 | $3,105 | $150,600 | $61,400 | $89,200 |
| 2019 | $2,906 | $146,600 | $60,800 | $85,800 |
| 2018 | $2,728 | $143,500 | $60,800 | $82,700 |
| 2017 | $2,613 | $141,000 | $59,000 | $82,000 |
| 2016 | $2,482 | $136,900 | $57,900 | $79,000 |
| 2015 | $2,329 | $134,700 | $57,300 | $77,400 |
Source: Public Records
Map
Nearby Homes
- 38 Prospect St
- 31 Greenwich St
- 0 Center St Unit 73415933
- 37 Franklin St
- 39 Rogers Ave
- 350 West Ave Unit 5
- 101 Ray St
- 24 Dumaine St
- 46-48 Milton St
- 0 N S Main St Io
- 517 Ideal Ln Unit 702
- 295 Main St
- 33 Connolly St
- 96 Lyons St
- 21 Wrona St
- 145 Moxon St
- 70 Sroka Ln
- 32 Lodge Ln Unit 32
- 64-66 Ferris St
- 36 Daniel St
Your Personal Tour Guide
Ask me questions while you tour the home.