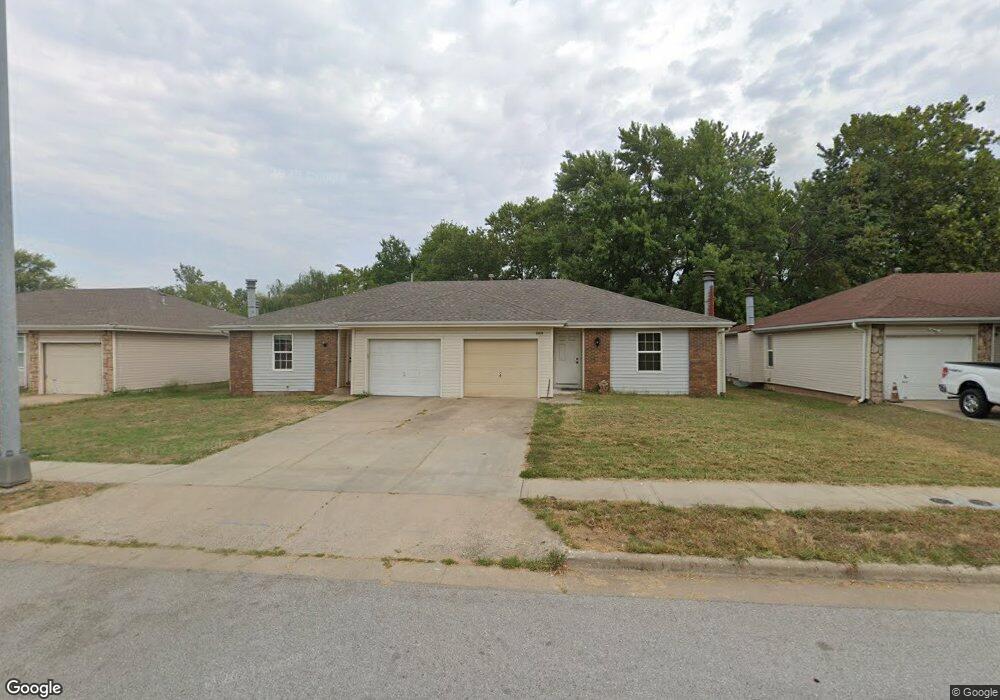
1141 W Sunset St Unit A & B Springfield, MO 65807
Mark Twain NeighborhoodEstimated Value: $232,000 - $247,794
Studio
2
Baths
1,880
Sq Ft
$129/Sq Ft
Est. Value
About This Home
This home is located at 1141 W Sunset St Unit A & B, Springfield, MO 65807 and is currently estimated at $241,949, approximately $128 per square foot. 1141 W Sunset St Unit A & B is a home located in Greene County with nearby schools including Holland Elementary School, Jarrett Middle, and Parkview High School.
Ownership History
Date
Name
Owned For
Owner Type
Purchase Details
Closed on
Dec 10, 2025
Sold by
Nguyen Buu and Nguyen Oanh
Bought by
Vilches Carmen and Garcia Adrian
Current Estimated Value
Home Financials for this Owner
Home Financials are based on the most recent Mortgage that was taken out on this home.
Original Mortgage
$265,000
Outstanding Balance
$265,000
Interest Rate
7.75%
Mortgage Type
Seller Take Back
Estimated Equity
-$23,051
Purchase Details
Closed on
Nov 14, 2025
Sold by
Nguyen Jennifer Y and Farmer Jennifer Y
Bought by
Nguyen Buu and Nguyen Oanh
Home Financials for this Owner
Home Financials are based on the most recent Mortgage that was taken out on this home.
Original Mortgage
$265,000
Outstanding Balance
$265,000
Interest Rate
7.75%
Mortgage Type
Seller Take Back
Estimated Equity
-$23,051
Purchase Details
Closed on
Jun 16, 2020
Sold by
Vantran Can and Nguyen Nguyet T
Bought by
Nguyen Jennifer Y
Home Financials for this Owner
Home Financials are based on the most recent Mortgage that was taken out on this home.
Original Mortgage
$70,000
Interest Rate
3.2%
Mortgage Type
Commercial
Purchase Details
Closed on
Jan 14, 2015
Sold by
Nguyen Nga Ngoc and Nguyen Dung
Bought by
Vanvantran Can Van and Nguyen Nguyet T
Home Financials for this Owner
Home Financials are based on the most recent Mortgage that was taken out on this home.
Original Mortgage
$96,000
Interest Rate
3.93%
Mortgage Type
Future Advance Clause Open End Mortgage
Purchase Details
Closed on
Nov 2, 2007
Sold by
Optima Properties Llc and Cravens Justin
Bought by
Tran Nga
Home Financials for this Owner
Home Financials are based on the most recent Mortgage that was taken out on this home.
Original Mortgage
$95,000
Interest Rate
7%
Mortgage Type
Assumption
Create a Home Valuation Report for This Property
The Home Valuation Report is an in-depth analysis detailing your home's value as well as a comparison with similar homes in the area
Home Values in the Area
Average Home Value in this Area
Purchase History
| Date | Buyer | Sale Price | Title Company |
|---|---|---|---|
| Vilches Carmen | -- | None Listed On Document | |
| Nguyen Buu | -- | None Listed On Document | |
| Nguyen Jennifer Y | -- | None Available | |
| Vanvantran Can Van | -- | None Available | |
| Tran Nga | -- | None Available |
Source: Public Records
Mortgage History
| Date | Status | Borrower | Loan Amount |
|---|---|---|---|
| Open | Vilches Carmen | $265,000 | |
| Previous Owner | Nguyen Jennifer Y | $70,000 | |
| Previous Owner | Vanvantran Can Van | $96,000 | |
| Previous Owner | Tran Nga | $95,000 |
Source: Public Records
Tax History
| Year | Tax Paid | Tax Assessment Tax Assessment Total Assessment is a certain percentage of the fair market value that is determined by local assessors to be the total taxable value of land and additions on the property. | Land | Improvement |
|---|---|---|---|---|
| 2025 | $1,533 | $30,780 | $6,840 | $23,940 |
| 2024 | $1,305 | $24,320 | $4,750 | $19,570 |
| 2023 | $1,297 | $24,320 | $4,750 | $19,570 |
| 2022 | $1,128 | $20,650 | $4,750 | $15,900 |
| 2021 | $1,128 | $20,650 | $4,750 | $15,900 |
| 2020 | $1,207 | $21,130 | $4,750 | $16,380 |
| 2019 | $1,173 | $21,130 | $4,750 | $16,380 |
| 2018 | $1,128 | $20,330 | $3,800 | $16,530 |
| 2017 | $1,116 | $20,500 | $3,800 | $16,700 |
| 2016 | $1,124 | $20,500 | $3,800 | $16,700 |
| 2015 | $1,113 | $20,500 | $3,800 | $16,700 |
| 2014 | $1,121 | $20,500 | $3,800 | $16,700 |
Source: Public Records
Map
Nearby Homes
- 2550 S Fort Ave
- 2546 S Fort Ave
- 2532 S Fort Ave
- 1116 W Broadmoor St
- 908 W Broadmoor St
- 2522 S Grant Ave
- 2852 S Pinehurst Ave
- 618 W Greenwood St
- 2331 S Missouri Ave
- 1514 W Broadmoor St
- 2449 S Westwood Ave
- 519 W Woodland St
- 1107 W Tracy St
- 1632 W Berkeley St
- 525 W Sunset St
- 3120 S Nettleton Ave
- 3128 S Dayton Ave
- 1419 W Whiteside St
- 3204 S Nettleton Ave
- 3219 S Franklin Ave
- 1141 W Sunset St
- 1131 W Sunset St
- 1131 W Sunset St
- 1131 W Sunset St Unit A&B
- 1201 A & B W Sunset St
- 1201 W Sunset St
- 1207 W Sunset St
- 1128 W Edgewood St
- 1123 W Sunset St
- 1123 W Sunset St Unit A & B
- 1136 W Edgewood St
- 1122 W Edgewood St
- 1200 W Edgewood St
- 1114 W Edgewood St
- 1117 W Sunset St
- 1117 W Sunset St Unit A & B
- 1117 W Sunset Street Unit #A & B St
- 1215 W Sunset St
- 1215 W Sunset St Unit B
- 1215 A & B W Sunset St
Your Personal Tour Guide
Ask me questions while you tour the home.