1145 Main St Mount Desert, ME 04660
Estimated Value: $699,000 - $739,000
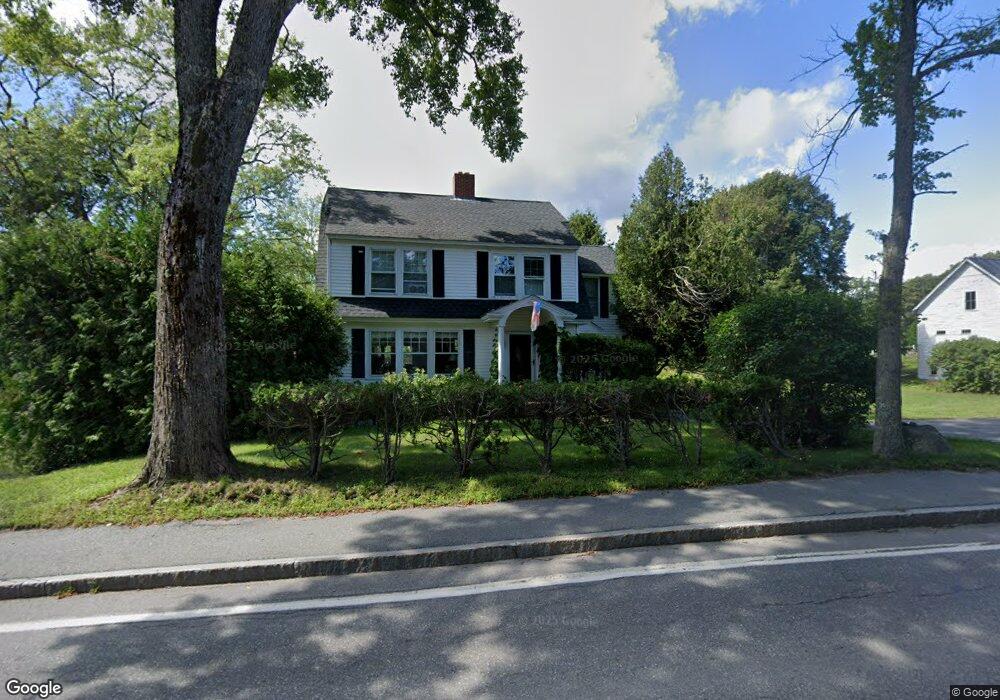
About This Home
This home is located at 1145 Main St, Mount Desert, ME 04660 and is currently estimated at $713,365, approximately $476 per square foot. 1145 Main St is a home located in Hancock County with nearby schools including Mt Desert Elementary School and Mt. Desert Island High School.
Ownership History
We collect this data history from publicly available records. To have your information removed, we recommend requesting removal directly through your county’s website.
Purchase Details
Purchase Details
Home Financials for this Owner
Home Financials are based on the most recent Mortgage that was taken out on this home.Purchase Details
Home Financials for this Owner
Home Financials are based on the most recent Mortgage that was taken out on this home.Purchase History
We collect this data history from publicly available records. To have your information removed, we recommend requesting removal directly through your county’s website.
| Date | Buyer | Sale Price | Title Company |
|---|---|---|---|
| $715,000 | -- | ||
| $715,000 | -- | ||
| $715,000 | -- | ||
| -- | None Available | ||
| -- | None Available | ||
| -- | None Available | ||
| -- | -- | ||
| -- | -- | ||
| -- | -- |
Mortgage History
We collect this data history from publicly available records. To have your information removed, we recommend requesting removal directly through your county’s website.
| Date | Status | Borrower | Loan Amount |
|---|---|---|---|
| Previous Owner | $385,000 | ||
| Previous Owner | $280,000 | ||
| Previous Owner | $200,000 |
Tax History
We collect this data history from publicly available records. To have your information removed, we recommend requesting removal directly through your county’s website.
| Year | Tax Paid | Tax Assessment Tax Assessment Total Assessment is a certain percentage of the fair market value that is determined by local assessors to be the total taxable value of land and additions on the property. | Land | Improvement |
|---|---|---|---|---|
| 2025 | $4,900 | $619,500 | $226,100 | $393,400 |
| 2024 | $4,801 | $516,200 | $188,400 | $327,800 |
| 2023 | $4,501 | $516,200 | $188,400 | $327,800 |
| 2022 | $4,150 | $516,200 | $188,400 | $327,800 |
| 2021 | $2,748 | $333,100 | $181,500 | $151,600 |
| 2020 | $2,658 | $333,100 | $181,500 | $151,600 |
| 2019 | $2,648 | $333,100 | $181,500 | $151,600 |
| 2018 | $2,555 | $333,100 | $181,500 | $151,600 |
| 2017 | $2,472 | $333,100 | $181,500 | $151,600 |
| 2016 | $2,422 | $333,100 | $181,500 | $151,600 |
| 2015 | $2,368 | $333,100 | $181,500 | $151,600 |
| 2013 | $2,258 | $333,100 | $181,500 | $151,600 |
Map
- 0 Balsam Ln Unit 1657282
- 99 Whitney Farm Rd
- 0 Red Spruce Way
- 213 Kimball Camp Rd
- 12 Hall Quarry Rd
- 70 Hall Quarry Rd
- 10-6 Vista Way
- 63-3 Oak Grove Rd
- Lot 2 Aspen Way
- Lot 7 Aspen Way
- 103 Pine Heath Rd
- Lot 39-1 Sargent Brook Rd
- 20 Giant Slide Rd
- 108 Stanley Mountain Rd
- 468 Indian Point Rd
- 28 Ridgewood Ln
- 502 Indian Point Rd
- 27 M J Ln
- 38 Indian Point Rd
- 6 Pams Way
Ask me questions while you tour the home.