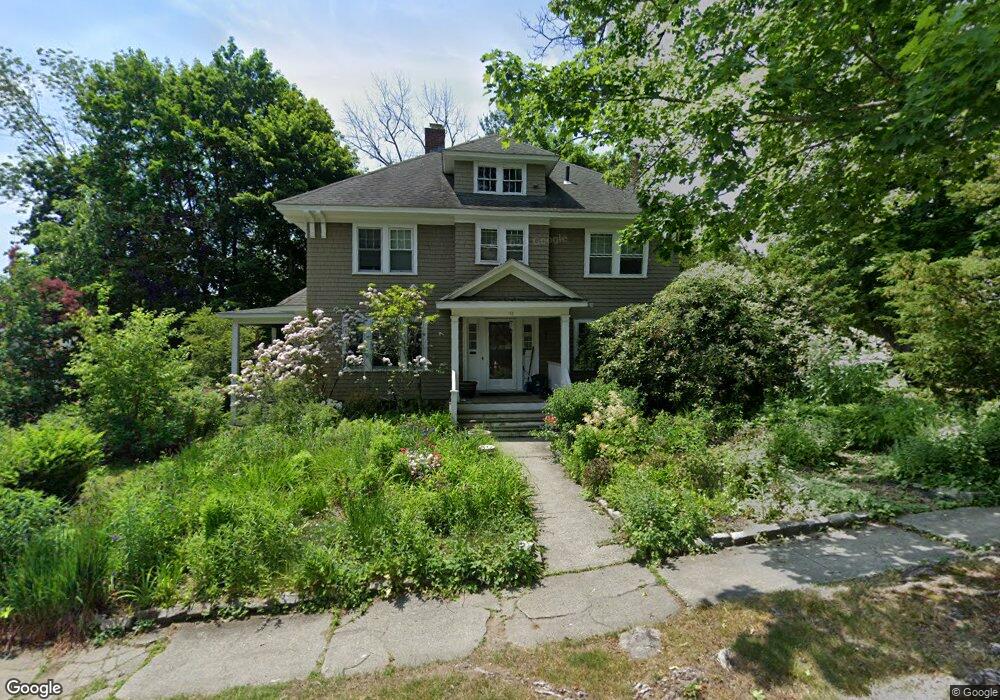
115 Beeching St Worcester, MA 01602
Newton Square NeighborhoodEstimated Value: $645,000 - $734,000
5
Beds
3
Baths
3,540
Sq Ft
$196/Sq Ft
Est. Value
About This Home
This home is located at 115 Beeching St, Worcester, MA 01602 and is currently estimated at $693,702, approximately $195 per square foot. 115 Beeching St is a home located in Worcester County with nearby schools including Chandler Magnet, Jacob Hiatt Magnet School, and Flagg Street School.
Ownership History
Date
Name
Owned For
Owner Type
Purchase Details
Closed on
Jun 9, 1993
Sold by
Richardson Robert and Richardson Kathleen
Bought by
Karpicz Joseph and Karpicz Gloria
Current Estimated Value
Home Financials for this Owner
Home Financials are based on the most recent Mortgage that was taken out on this home.
Original Mortgage
$170,000
Interest Rate
7.41%
Mortgage Type
Purchase Money Mortgage
Create a Home Valuation Report for This Property
The Home Valuation Report is an in-depth analysis detailing your home's value as well as a comparison with similar homes in the area
Home Values in the Area
Average Home Value in this Area
Purchase History
| Date | Buyer | Sale Price | Title Company |
|---|---|---|---|
| Karpicz Joseph | $201,000 | -- |
Source: Public Records
Mortgage History
| Date | Status | Borrower | Loan Amount |
|---|---|---|---|
| Open | Karpicz Joseph | $110,000 | |
| Closed | Karpicz Joseph | $170,000 | |
| Previous Owner | Karpicz Joseph | $30,000 | |
| Previous Owner | Karpicz Joseph | $20,000 |
Source: Public Records
Tax History
| Year | Tax Paid | Tax Assessment Tax Assessment Total Assessment is a certain percentage of the fair market value that is determined by local assessors to be the total taxable value of land and additions on the property. | Land | Improvement |
|---|---|---|---|---|
| 2025 | $8,254 | $625,800 | $123,800 | $502,000 |
| 2024 | $8,019 | $583,200 | $123,800 | $459,400 |
| 2023 | $7,735 | $539,400 | $106,600 | $432,800 |
| 2022 | $7,191 | $472,800 | $85,300 | $387,500 |
| 2021 | $7,026 | $431,600 | $68,200 | $363,400 |
| 2020 | $6,973 | $410,200 | $68,000 | $342,200 |
| 2019 | $7,088 | $393,800 | $65,700 | $328,100 |
| 2018 | $6,997 | $370,000 | $65,700 | $304,300 |
| 2017 | $6,988 | $363,600 | $65,700 | $297,900 |
| 2016 | $7,242 | $351,400 | $54,300 | $297,100 |
| 2015 | $7,053 | $351,400 | $54,300 | $297,100 |
| 2014 | $6,860 | $351,100 | $54,300 | $296,800 |
Source: Public Records
Map
Nearby Homes
- 31 Lenox St
- 860 Pleasant St
- 2 Saxon Rd
- 26 Westbrook Rd
- 73 Moore Ave
- 10 Wrentham Rd Unit 308
- 23 Orrison St
- 42 Ellis Dr
- 15 Chesterfield Rd
- 118 Beaconsfield Rd
- 437 Salisbury St
- 7 Longworth Rd
- 18 Hadwen Ln
- 122 Copperfield Rd
- 16 Sherwood Rd
- 3 Westwood Dr
- 15 Dennison Rd
- 93 Newton Ave N
- 163 Moreland St
- 6 Paul Revere Rd
Your Personal Tour Guide
Ask me questions while you tour the home.