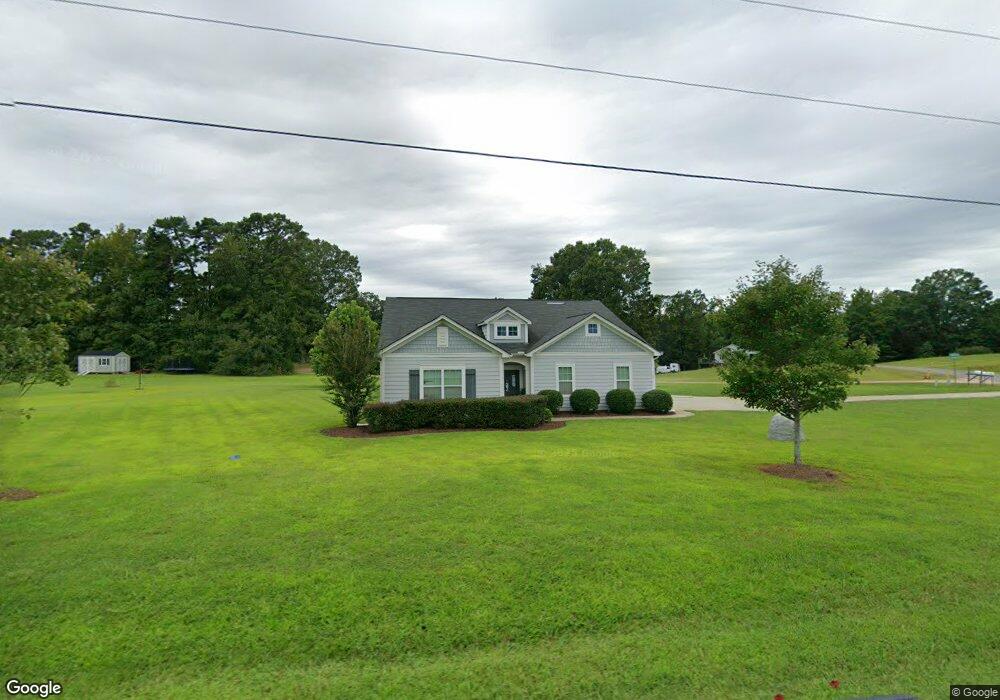
115 Bruner Sloop Rd Unit CAS0049 China Grove, NC 28023
Estimated Value: $335,000 - $530,000
3
Beds
2
Baths
1,950
Sq Ft
$220/Sq Ft
Est. Value
About This Home
This home is located at 115 Bruner Sloop Rd Unit CAS0049, China Grove, NC 28023 and is currently estimated at $428,579, approximately $219 per square foot. 115 Bruner Sloop Rd Unit CAS0049 is a home located in Rowan County with nearby schools including Bostian Elementary School, China Grove Middle School, and Jesse C Carson High School.
Ownership History
Date
Name
Owned For
Owner Type
Purchase Details
Closed on
May 24, 2017
Sold by
Shea Real Estate Investments Llc
Bought by
Martinez Rebollar Jose Martinez and Martinez Hernandez Viviana Ixel
Current Estimated Value
Home Financials for this Owner
Home Financials are based on the most recent Mortgage that was taken out on this home.
Original Mortgage
$225,931
Outstanding Balance
$187,294
Interest Rate
4.5%
Mortgage Type
FHA
Estimated Equity
$241,285
Purchase Details
Closed on
Oct 11, 2016
Sold by
Shea Castlebrook Llc
Bought by
Shea Real Estate Investments Llc
Purchase Details
Closed on
Jul 25, 2012
Sold by
Bank Of North Carolina
Bought by
Shea Castlebrooke Llc
Purchase Details
Closed on
Sep 20, 2011
Sold by
Triune Development Llc
Bought by
Bank Of North Carolina
Create a Home Valuation Report for This Property
The Home Valuation Report is an in-depth analysis detailing your home's value as well as a comparison with similar homes in the area
Home Values in the Area
Average Home Value in this Area
Purchase History
| Date | Buyer | Sale Price | Title Company |
|---|---|---|---|
| Martinez Rebollar Jose Martinez | $230,500 | None Available | |
| Shea Real Estate Investments Llc | -- | None Available | |
| Shea Castlebrooke Llc | -- | None Available | |
| Shea Castlebrook Llc | $625,000 | None Available | |
| Bank Of North Carolina | $792,000 | None Available |
Source: Public Records
Mortgage History
| Date | Status | Borrower | Loan Amount |
|---|---|---|---|
| Open | Martinez Rebollar Jose Martinez | $225,931 |
Source: Public Records
Tax History
| Year | Tax Paid | Tax Assessment Tax Assessment Total Assessment is a certain percentage of the fair market value that is determined by local assessors to be the total taxable value of land and additions on the property. | Land | Improvement |
|---|---|---|---|---|
| 2025 | $2,512 | $374,998 | $48,000 | $326,998 |
| 2024 | $2,512 | $374,998 | $48,000 | $326,998 |
| 2023 | $2,512 | $374,998 | $48,000 | $326,998 |
| 2022 | $1,779 | $237,957 | $40,000 | $197,957 |
| 2021 | $1,766 | $237,957 | $40,000 | $197,957 |
| 2020 | $1,766 | $237,957 | $40,000 | $197,957 |
| 2019 | $1,766 | $237,957 | $40,000 | $197,957 |
| 2018 | $1,468 | $199,461 | $40,000 | $159,461 |
| 2017 | $250 | $34,000 | $34,000 | $0 |
| 2016 | $250 | $34,000 | $34,000 | $0 |
| 2015 | $254 | $34,000 | $34,000 | $0 |
| 2014 | $348 | $48,875 | $48,875 | $0 |
Source: Public Records
Map
Nearby Homes
- 1060 Dublin Ct
- 2865 Lentz Rd
- 1103 Hastings Ct
- 2720 Lentz Rd
- 165 Wellington Estates Dr
- 145 Wellington Estates Dr
- 0 State Rd
- 2570 Lentz Rd
- 990 Old Linn Rd
- 1580 Pine Ridge Rd
- 410 Geneva Dr
- 1030 China Grove Rd
- 2710 Trawler Way
- 2705 Trawler Way
- 2715 Trawler Way
- 2720 Trawler Way
- 2700 Trawler Way
- 6230 Lumber Ln
- 8900 Old Concord Rd
- 2685 Trawler Way
- 3715 Lentz Rd Unit CAS0049
- 3715 Lentz Rd
- 3735 Old Beatty Ford Rd Unit 50
- 3735 Lentz Rd Unit CAS0050
- 3735 Lentz Rd
- 130 Bruner Sloop Rd
- 180 Harvest Ln
- 3785 Lentz Rd
- 3755 Lentz Rd
- 165 Bruner Sloop Rd
- 1153 Dublin Ct
- 1153 Dublin Ct Unit 44
- 265 Harvest Ln
- 160 Bruner Sloop Rd
- 1129 Dublin Ct
- 1181 Dublin Ct
- 3785 Old Beatty Ford Rd
- 3789 Lentz Rd
- 1201 Dublin Ct
- 1085 Dublin Ct
Your Personal Tour Guide
Ask me questions while you tour the home.