115 E Frank Ave Westport, WA 98595
Estimated Value: $282,000 - $392,000
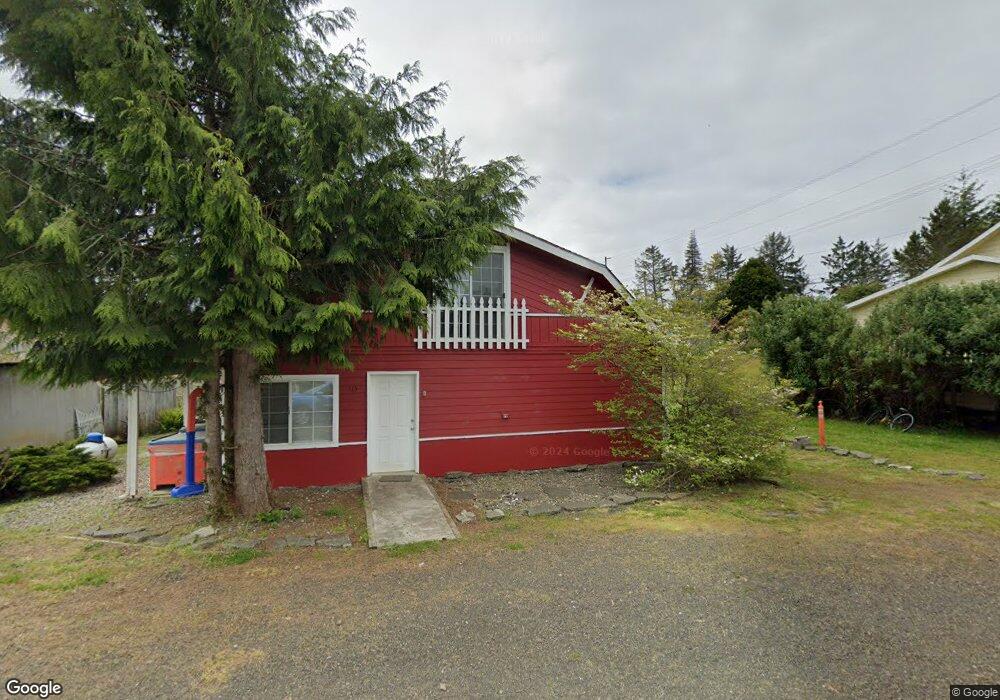
About This Home
This home is located at 115 E Frank Ave, Westport, WA 98595 and is currently estimated at $312,086, approximately $161 per square foot. 115 E Frank Ave is a home with nearby schools including Ocosta Elementary School and Ocosta Junior/Senior High School.
Ownership History
We collect this data history from publicly available records. To have your information removed, we recommend requesting removal directly through your county’s website.
Purchase Details
Home Financials for this Owner
Home Financials are based on the most recent Mortgage that was taken out on this home.Home Values in the Area
Average Home Value in this Area
Purchase History
We collect this data history from publicly available records. To have your information removed, we recommend requesting removal directly through your county’s website.
| Date | Buyer | Sale Price | Title Company |
|---|---|---|---|
| $108,350 | Coast Title |
Mortgage History
We collect this data history from publicly available records. To have your information removed, we recommend requesting removal directly through your county’s website.
| Date | Status | Borrower | Loan Amount |
|---|---|---|---|
| Open | $86,680 |
Tax History
We collect this data history from publicly available records. To have your information removed, we recommend requesting removal directly through your county’s website.
| Year | Tax Paid | Tax Assessment Tax Assessment Total Assessment is a certain percentage of the fair market value that is determined by local assessors to be the total taxable value of land and additions on the property. | Land | Improvement |
|---|---|---|---|---|
| 2025 | $2,309 | $271,215 | $53,770 | $217,445 |
| 2023 | $2,106 | $235,422 | $48,887 | $186,535 |
| 2022 | $2,129 | $184,848 | $19,950 | $164,898 |
| 2021 | $1,926 | $184,848 | $19,950 | $164,898 |
| 2020 | $1,329 | $152,936 | $19,000 | $133,936 |
| 2019 | $1,191 | $101,069 | $12,240 | $88,829 |
| 2018 | $1,141 | $92,994 | $12,240 | $80,754 |
| 2017 | $938 | $79,535 | $12,240 | $67,295 |
| 2016 | $1,014 | $79,535 | $12,240 | $67,295 |
| 2014 | -- | $81,340 | $12,240 | $69,100 |
| 2013 | -- | $102,060 | $14,400 | $87,660 |
Map
- 1251 S Ocosta St
- 1620 S Ocosta St
- 1623 Cooper St S
- 1321 S Melbourne St
- 1306 Melbourne Ct
- 1845 S Montesano St Unit 401
- 520 W Newell Ave
- 0 W Newell Ave
- 802 S 1st St
- 405 W Alder Ave
- 1220 S Forrest St
- 731 S Broadway
- 221 W Hunley Ave
- 802 S Forrest St Unit 4
- 1930 S Forrest St
- 715 S Forrest St
- 190 W Veterans Ave
- 1123 Aberdeen St S
- 1856 S Hoquiam Ln
- 1215 Johnson St
- 148 W Lila Ave
- 148 Lila Ave
- 120 E Lila Ave
- 1305 S 1st St
- 1326 S Forrest St
- 1326 S Forrest St
- 1326 S Montesano St
- 1322 S Montesano St
- 241 E Lila Ave
- 1316 S Montesano St
- 1404 S Montesano St
- 1310 S Montesano St
- 1410 S Forrest St
- 604 S 2nd St
- 608 S 2nd St
- 610 S 2nd St
- 0 S 2nd St
- 1420 S 1st St
- 251 E Frank Ave
- 1 XW E Frank Ave
Ask me questions while you tour the home.