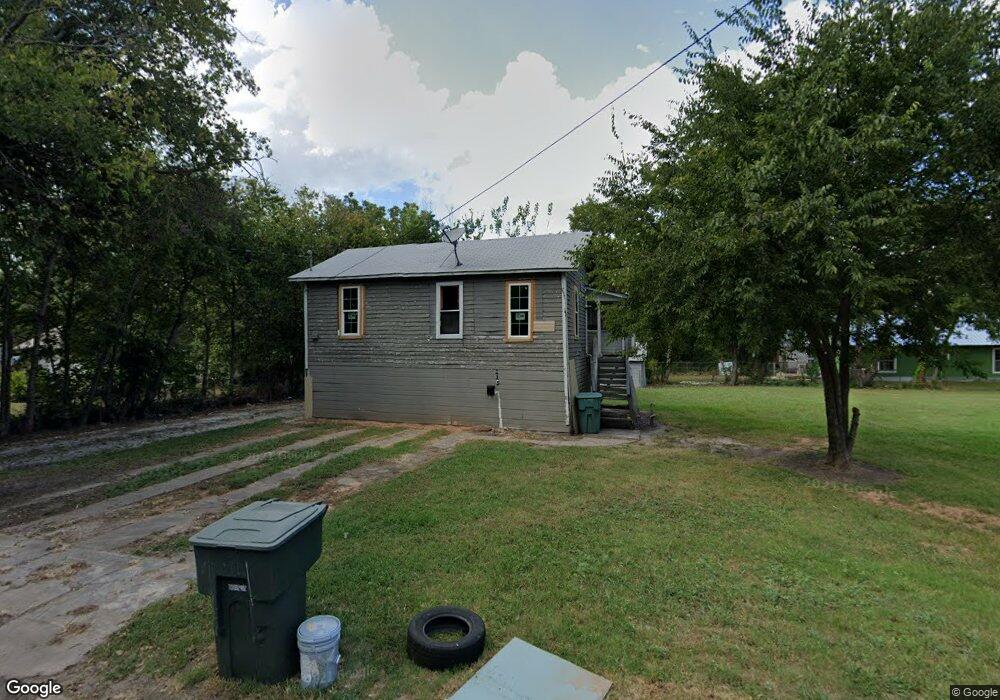
115 E Olive St Sherman, TX 75090
Estimated Value: $131,104 - $273,000
Studio
--
Bath
580
Sq Ft
$348/Sq Ft
Est. Value
About This Home
This home is located at 115 E Olive St, Sherman, TX 75090 and is currently estimated at $202,052, approximately $348 per square foot. 115 E Olive St is a home located in Grayson County with nearby schools including Washington Elementary School, Piner Middle School, and Dillingham Intermediate School.
Ownership History
Date
Name
Owned For
Owner Type
Purchase Details
Closed on
Apr 4, 2019
Sold by
Atnip Michael L and Atnip Michael Lee
Bought by
Sanchez Jaime Antonio
Current Estimated Value
Home Financials for this Owner
Home Financials are based on the most recent Mortgage that was taken out on this home.
Original Mortgage
$20,400
Outstanding Balance
$17,935
Interest Rate
4.3%
Mortgage Type
Purchase Money Mortgage
Estimated Equity
$184,117
Create a Home Valuation Report for This Property
The Home Valuation Report is an in-depth analysis detailing your home's value as well as a comparison with similar homes in the area
Home Values in the Area
Average Home Value in this Area
Purchase History
| Date | Buyer | Sale Price | Title Company |
|---|---|---|---|
| Sanchez Jaime Antonio | -- | None Available |
Source: Public Records
Mortgage History
| Date | Status | Borrower | Loan Amount |
|---|---|---|---|
| Open | Sanchez Jaime Antonio | $20,400 |
Source: Public Records
Tax History
| Year | Tax Paid | Tax Assessment Tax Assessment Total Assessment is a certain percentage of the fair market value that is determined by local assessors to be the total taxable value of land and additions on the property. | Land | Improvement |
|---|---|---|---|---|
| 2025 | $2,611 | $122,086 | $55,732 | $66,354 |
| 2024 | $2,611 | $119,040 | $51,278 | $67,762 |
| 2023 | $2,729 | $124,301 | $36,062 | $88,239 |
| 2022 | $2,266 | $96,677 | $36,062 | $60,615 |
| 2021 | $1,708 | $68,134 | $25,344 | $42,790 |
| 2020 | $1,413 | $56,393 | $13,398 | $42,995 |
| 2019 | $596 | $22,128 | $2,970 | $19,158 |
| 2018 | $408 | $15,128 | $2,970 | $12,158 |
| 2017 | $400 | $15,956 | $2,970 | $12,986 |
| 2016 | $534 | $21,466 | $2,970 | $18,496 |
| 2015 | $491 | $19,762 | $2,970 | $16,792 |
| 2014 | $488 | $19,652 | $2,970 | $16,682 |
Source: Public Records
Map
Nearby Homes
- 1601 S Travis St
- 1326 S Walnut St
- 1615 Travis St
- 1429 S Elm St
- 1323 S Montgomery St
- 1219 S Montgomery St
- 1220 S Branch St
- 720 S Montgomery St
- 1112 S Travis St
- 1905 S Walnut St
- 000 S Branch St
- 1228 S Rusk St
- 1114 S Crockett St
- TBD Branch St
- TBD S Branch St
- 1426 S Austin St
- 1032 S Montgomery St
- 413 W Dulin St
- 2901 S 1st St
- C S Inwood St
- 1428 S Walnut St
- 119 E Olive St
- 1443 S Travis St
- 1502 S Walnut St
- 1424 S Walnut St
- 1437 S Travis St
- 1433 S Travis St
- 1433 S Travis St Unit B
- 1433 S Travis St Unit A
- 1504 S Walnut St
- 1503 S Travis St
- 1419 S Travis St
- 1508 S Walnut St
- 1439 S Walnut St
- 1437 S Walnut St
- 1503 S Walnut St
- 1435 S Walnut St
- 1420 S Walnut St
- 1502 S Travis St
- 1415 S Travis St
Your Personal Tour Guide
Ask me questions while you tour the home.