Estimated Value: $89,000 - $192,000
6
Beds
2
Baths
2,640
Sq Ft
$48/Sq Ft
Est. Value
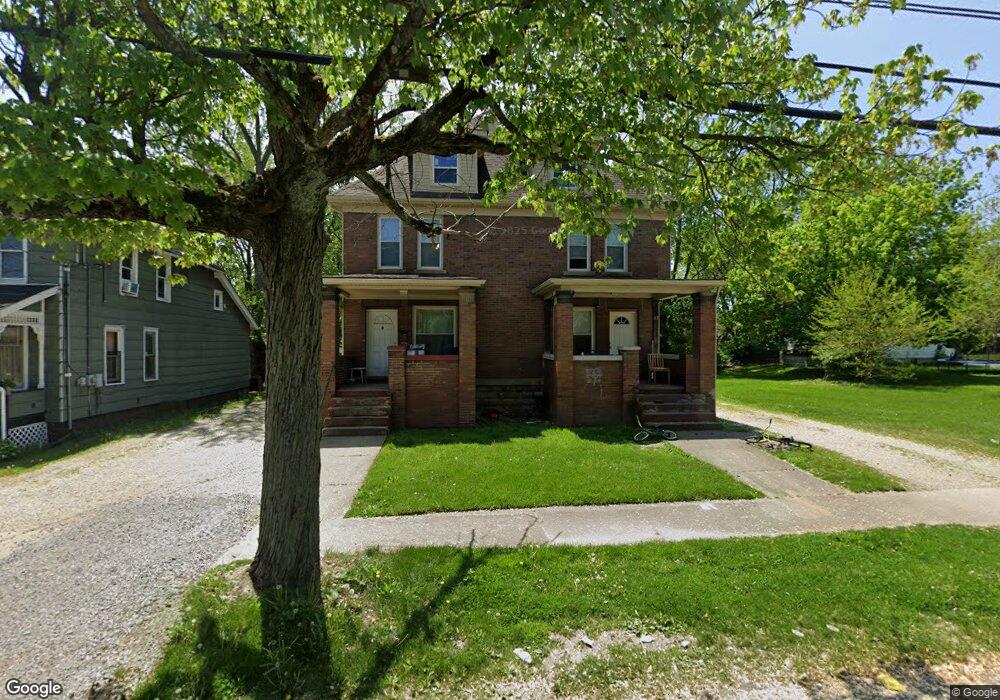
About This Home
This home is located at 115 Maple St, Niles, OH 44446 and is currently estimated at $127,215, approximately $48 per square foot. 115 Maple St is a home located in Trumbull County with nearby schools including Niles Primary School, Niles Intermediate School, and Niles Middle School.
Ownership History
Date
Name
Owned For
Owner Type
Purchase Details
Closed on
Nov 28, 2012
Sold by
Gerke William H and Gerke Patricia L
Bought by
G & G Rental Properties Llc
Current Estimated Value
Purchase Details
Closed on
Jul 13, 2006
Sold by
Pereiro Nieves R
Bought by
G & G Rental Properties Llc
Purchase Details
Closed on
Jun 22, 2006
Sold by
Pereiro Nieves R
Bought by
G & G Rental Properties Llc
Purchase Details
Closed on
Jan 1, 1990
Bought by
Nieves R Pereiro Tr
Create a Home Valuation Report for This Property
The Home Valuation Report is an in-depth analysis detailing your home's value as well as a comparison with similar homes in the area
Home Values in the Area
Average Home Value in this Area
Purchase History
| Date | Buyer | Sale Price | Title Company |
|---|---|---|---|
| G & G Rental Properties Llc | -- | None Available | |
| G & G Rental Properties Llc | $10,000 | None Available | |
| G & G Rental Properties Llc | $10,000 | None Available | |
| Nieves R Pereiro Tr | -- | -- |
Source: Public Records
Tax History
| Year | Tax Paid | Tax Assessment Tax Assessment Total Assessment is a certain percentage of the fair market value that is determined by local assessors to be the total taxable value of land and additions on the property. | Land | Improvement |
|---|---|---|---|---|
| 2025 | $1,719 | $39,730 | $2,700 | $37,030 |
| 2024 | $1,719 | $39,730 | $2,700 | $37,030 |
| 2023 | $1,704 | $39,730 | $2,700 | $37,030 |
| 2022 | $810 | $16,140 | $2,700 | $13,440 |
| 2021 | $851 | $16,140 | $2,700 | $13,440 |
| 2020 | $859 | $16,140 | $2,700 | $13,440 |
| 2019 | $873 | $15,620 | $2,700 | $12,920 |
| 2018 | $870 | $15,620 | $2,700 | $12,920 |
| 2017 | $866 | $15,620 | $2,700 | $12,920 |
| 2016 | $1,152 | $20,590 | $2,700 | $17,890 |
| 2015 | $1,140 | $20,590 | $2,700 | $17,890 |
| 2014 | $1,144 | $20,590 | $2,700 | $17,890 |
| 2013 | $1,213 | $23,040 | $2,700 | $20,340 |
Source: Public Records
Map
Nearby Homes
Your Personal Tour Guide
Ask me questions while you tour the home.