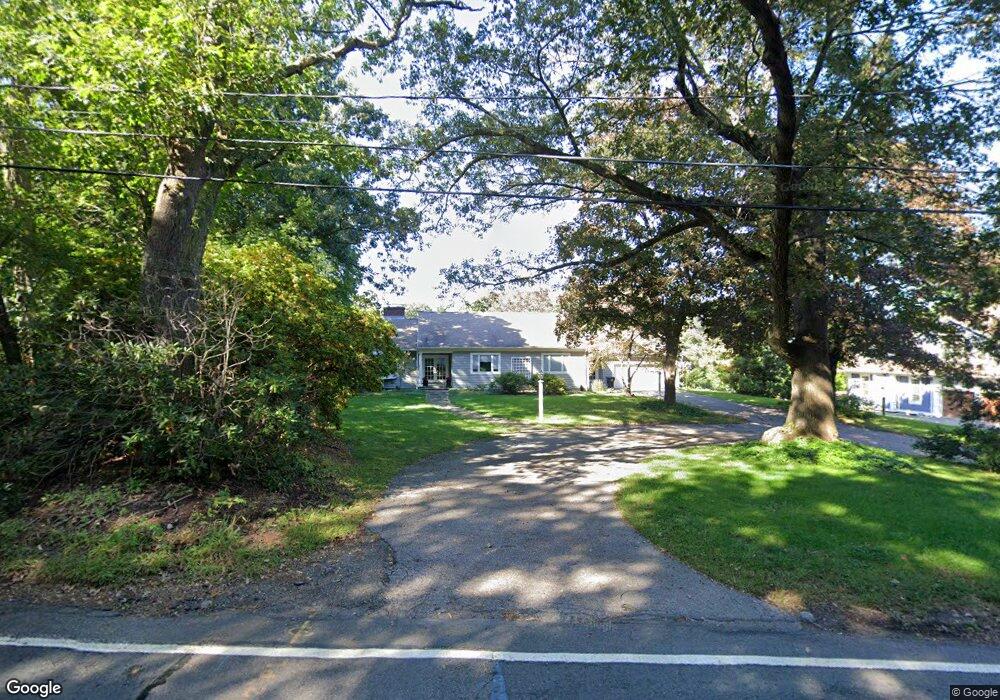
115 Marsh St Belmont, MA 02478
Belmont Hill NeighborhoodEstimated Value: $2,124,000 - $2,737,000
4
Beds
3
Baths
3,266
Sq Ft
$728/Sq Ft
Est. Value
About This Home
This home is located at 115 Marsh St, Belmont, MA 02478 and is currently estimated at $2,376,060, approximately $727 per square foot. 115 Marsh St is a home located in Middlesex County with nearby schools including Winn Brook Elementary School, Winthrop L Chenery Middle School, and Belmont High School.
Ownership History
Date
Name
Owned For
Owner Type
Purchase Details
Closed on
Mar 12, 2026
Sold by
Bertozzi Paul
Bought by
Paul Bertozzi and Paul Bertozzi
Current Estimated Value
Purchase Details
Closed on
Oct 28, 2015
Sold by
Koepke Margaret
Bought by
Bertozzi Paul and Fox Margaret K
Purchase Details
Closed on
Oct 1, 2004
Sold by
Koepke Gary and Koepke Margaret L
Bought by
Koepke Margaret
Purchase Details
Closed on
Apr 30, 1996
Sold by
Kolligian Madeline
Bought by
Koepke Gary and Koepke Margaret L
Create a Home Valuation Report for This Property
The Home Valuation Report is an in-depth analysis detailing your home's value as well as a comparison with similar homes in the area
Home Values in the Area
Average Home Value in this Area
Purchase History
We collect this data history from publicly available records. To have your information removed, we recommend requesting removal directly through your county’s website.
| Date | Buyer | Sale Price | Title Company |
|---|---|---|---|
| Paul Bertozzi | -- | -- | |
| Bertozzi Paul | -- | -- | |
| Koepke Margaret | -- | -- | |
| Koepke Margaret | -- | -- | |
| Koepke Gary | $542,500 | -- |
Source: Public Records
Mortgage History
We collect this data history from publicly available records. To have your information removed, we recommend requesting removal directly through your county’s website.
| Date | Status | Borrower | Loan Amount |
|---|---|---|---|
| Previous Owner | Koepke Gary | $410,000 | |
| Previous Owner | Koepke Gary | $150,000 |
Source: Public Records
Tax History
| Year | Tax Paid | Tax Assessment Tax Assessment Total Assessment is a certain percentage of the fair market value that is determined by local assessors to be the total taxable value of land and additions on the property. | Land | Improvement |
|---|---|---|---|---|
| 2025 | $24,648 | $2,164,000 | $1,019,000 | $1,145,000 |
| 2024 | $22,007 | $2,084,000 | $1,158,000 | $926,000 |
| 2023 | $22,941 | $2,041,000 | $1,199,000 | $842,000 |
| 2022 | $21,938 | $1,876,000 | $1,097,000 | $779,000 |
| 2021 | $5,381 | $1,901,000 | $1,150,000 | $751,000 |
| 2020 | $19,976 | $1,816,000 | $1,073,000 | $743,000 |
| 2019 | $6,689 | $1,533,000 | $827,000 | $706,000 |
| 2018 | $5,041 | $1,451,000 | $752,000 | $699,000 |
| 2017 | $15,939 | $1,256,000 | $689,000 | $567,000 |
| 2016 | $15,713 | $1,251,000 | $689,000 | $562,000 |
| 2015 | $15,480 | $1,200,000 | $596,000 | $604,000 |
Source: Public Records
Map
Nearby Homes
- 135 Marsh St
- 45 Wellesley Rd
- 55 Crestview Rd
- 43 Prentiss Ln
- 28 Tyler Rd
- 24 Bellington St
- 53 Birch Hill Rd
- 70 Birch Hill Rd
- 765 Concord Turnpike
- 14 Arlmont St
- 150 Prospect St
- 22 Garfield Rd
- 147 Charlton St
- 211 Florence Ave
- 23 Centre Ave
- 490 Pleasant St
- 64 Browning Rd
- 10 Radcliffe Rd
- 2 Ely Rd
- 62 Thomas St
- 127 Marsh St
- 107 Marsh St
- 107 Marsh St
- 60 Evergreen Way
- 54 Evergreen Way
- 54 Evergreen Way Unit 54
- 54 Evergreen Way
- 44 Evergreen Way
- 70 Evergreen Way
- 142 Marsh St
- 95 Marsh St
- 67 Evergreen Way
- 38 Evergreen Way
- 130 Marsh St
- 51 Evergreen Way
- 80 Evergreen Way
- 178 Marsh St
- 77 Evergreen Way
- 24 Evergreen Way
- 14 Crestview Rd
Your Personal Tour Guide
Ask me questions while you tour the home.