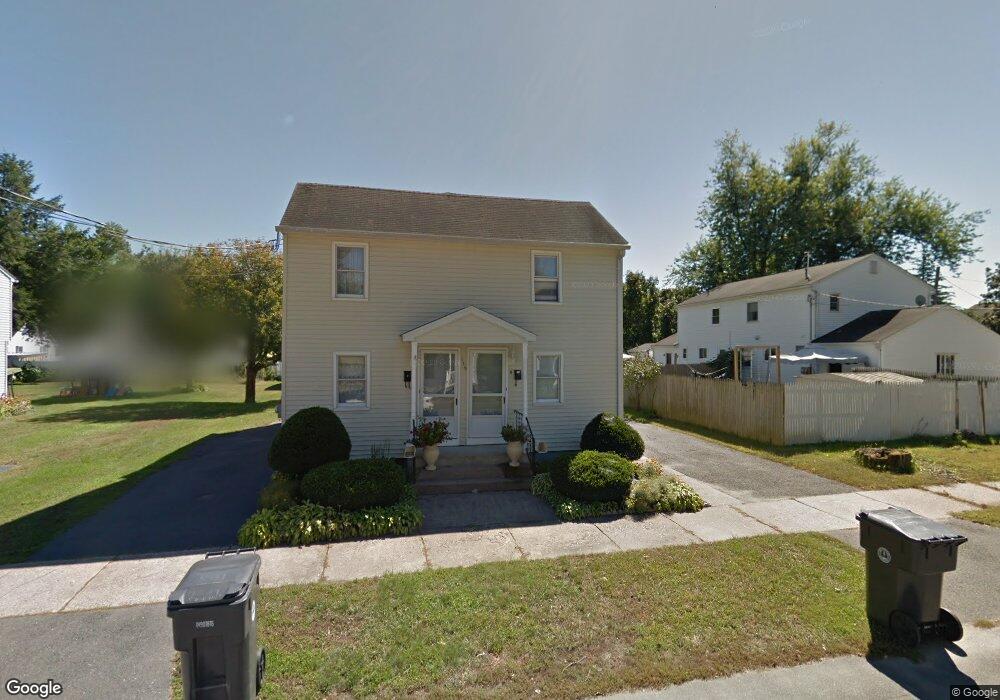
115 Otis St Westfield, MA 01085
Estimated Value: $281,839 - $354,000
4
Beds
2
Baths
1,680
Sq Ft
$190/Sq Ft
Est. Value
About This Home
This home is located at 115 Otis St, Westfield, MA 01085 and is currently estimated at $319,960, approximately $190 per square foot. 115 Otis St is a home located in Hampden County with nearby schools including Westfield High School and Saint Mary High School.
Ownership History
Date
Name
Owned For
Owner Type
Purchase Details
Closed on
Jul 31, 1998
Sold by
Fisher Alma I and Fisher Kimberly S
Bought by
Pavlyuk Yuriy and Pavlyuk Valentino
Current Estimated Value
Home Financials for this Owner
Home Financials are based on the most recent Mortgage that was taken out on this home.
Original Mortgage
$89,000
Outstanding Balance
$18,567
Interest Rate
6.92%
Mortgage Type
Purchase Money Mortgage
Estimated Equity
$301,393
Purchase Details
Closed on
Jul 29, 1988
Sold by
Krieger John H
Bought by
Fisher Kimberly S
Create a Home Valuation Report for This Property
The Home Valuation Report is an in-depth analysis detailing your home's value as well as a comparison with similar homes in the area
Home Values in the Area
Average Home Value in this Area
Purchase History
| Date | Buyer | Sale Price | Title Company |
|---|---|---|---|
| Pavlyuk Yuriy | $99,000 | -- | |
| Fisher Kimberly S | $75,100 | -- |
Source: Public Records
Mortgage History
| Date | Status | Borrower | Loan Amount |
|---|---|---|---|
| Open | Fisher Kimberly S | $89,000 | |
| Previous Owner | Fisher Kimberly S | $90,000 |
Source: Public Records
Tax History
| Year | Tax Paid | Tax Assessment Tax Assessment Total Assessment is a certain percentage of the fair market value that is determined by local assessors to be the total taxable value of land and additions on the property. | Land | Improvement |
|---|---|---|---|---|
| 2025 | $3,470 | $228,600 | $77,300 | $151,300 |
| 2024 | $3,434 | $215,000 | $70,200 | $144,800 |
| 2023 | $3,060 | $193,500 | $66,900 | $126,600 |
| 2022 | $3,060 | $165,500 | $59,700 | $105,800 |
| 2021 | $2,964 | $157,000 | $56,400 | $100,600 |
| 2020 | $2,872 | $149,200 | $56,400 | $92,800 |
| 2019 | $2,805 | $142,600 | $53,700 | $88,900 |
| 2018 | $2,509 | $129,600 | $53,700 | $75,900 |
| 2017 | $2,480 | $127,700 | $54,400 | $73,300 |
| 2016 | $2,482 | $127,700 | $54,400 | $73,300 |
| 2015 | $2,368 | $127,700 | $54,400 | $73,300 |
| 2014 | $1,767 | $127,700 | $54,400 | $73,300 |
Source: Public Records
Map
Nearby Homes
- 100 Meadow St
- 97 Mechanic St
- 88 Woodmont St
- Lot 5 Montgomery
- 9 Montgomery St
- 19 Kellogg St
- 13 Green Ave
- 13 Hampden St
- 0 Lockhouse Rd Unit 73496193
- 19 Arch Rd
- 32 Allen Ave
- 336 Paper Mill Rd
- 20 Perkins St
- 64 Brookline Ave
- 16 Squawfield Rd
- 242 Eastwood Dr
- 70 S Maple St
- 26 Hayre St
- 48 Blueberry Ridge
- 182 Lockhouse Rd
Your Personal Tour Guide
Ask me questions while you tour the home.