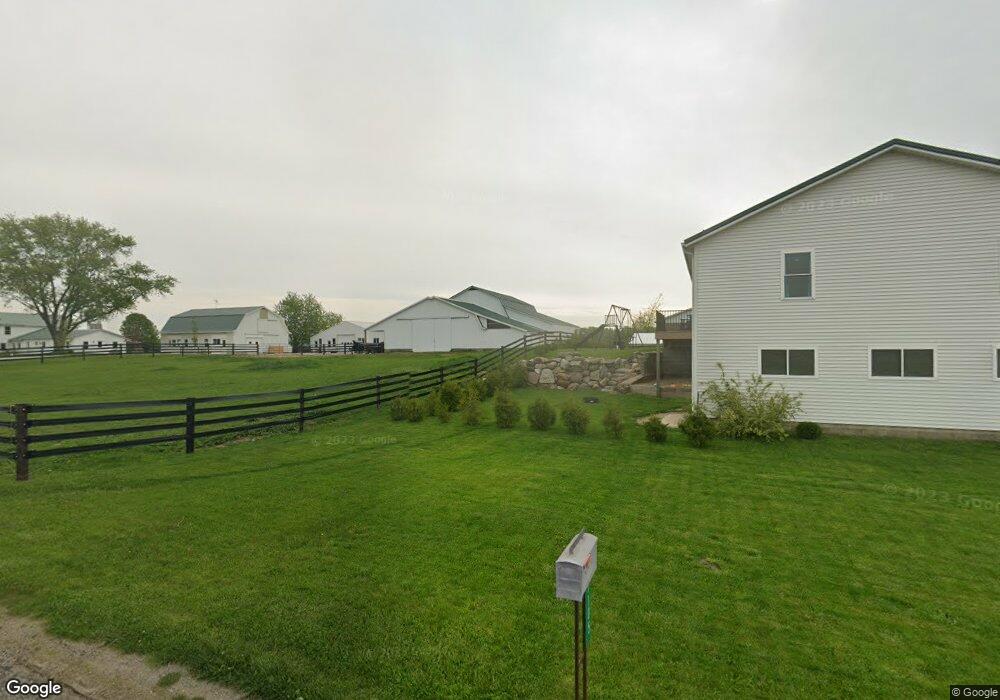
1155 N 100 W Lagrange, IN 46761
Estimated Value: $378,000 - $589,889
3
Beds
1
Bath
4,056
Sq Ft
$122/Sq Ft
Est. Value
About This Home
This home is located at 1155 N 100 W, Lagrange, IN 46761 and is currently estimated at $494,630, approximately $121 per square foot. 1155 N 100 W is a home located in LaGrange County with nearby schools including Lakeland Jr/Sr High School, Pleasant Acres School, and Woodside School.
Ownership History
Date
Name
Owned For
Owner Type
Purchase Details
Closed on
Jan 29, 2021
Sold by
Coblentz Joseph S and Coblentz Amanda E
Bought by
Wickey Levi and Bontrager Mary
Current Estimated Value
Home Financials for this Owner
Home Financials are based on the most recent Mortgage that was taken out on this home.
Original Mortgage
$40,050
Outstanding Balance
$21,025
Interest Rate
2.67%
Mortgage Type
Construction
Estimated Equity
$473,605
Purchase Details
Closed on
Jun 20, 2017
Sold by
Hochstetler Levi H and Hochstetler Katie J
Bought by
Coblentz Joseph S and Coblentz Amanda E
Create a Home Valuation Report for This Property
The Home Valuation Report is an in-depth analysis detailing your home's value as well as a comparison with similar homes in the area
Home Values in the Area
Average Home Value in this Area
Purchase History
We collect this data history from publicly available records. To have your information removed, we recommend requesting removal directly through your county’s website.
| Date | Buyer | Sale Price | Title Company |
|---|---|---|---|
| Wickey Levi | $445,000 | Lagrange Title Co | |
| Coblentz Joseph S | -- | Attorney Only |
Source: Public Records
Mortgage History
We collect this data history from publicly available records. To have your information removed, we recommend requesting removal directly through your county’s website.
| Date | Status | Borrower | Loan Amount |
|---|---|---|---|
| Open | Wickey Levi | $40,050 |
Source: Public Records
Tax History
| Year | Tax Paid | Tax Assessment Tax Assessment Total Assessment is a certain percentage of the fair market value that is determined by local assessors to be the total taxable value of land and additions on the property. | Land | Improvement |
|---|---|---|---|---|
| 2025 | $3,662 | $452,800 | $64,500 | $388,300 |
| 2024 | $3,662 | $429,100 | $66,100 | $363,000 |
| 2023 | $3,524 | $405,900 | $61,900 | $344,000 |
| 2022 | $3,450 | $369,600 | $53,000 | $316,600 |
| 2021 | $1,723 | $318,000 | $47,200 | $270,800 |
| 2020 | $4,034 | $312,100 | $47,100 | $265,000 |
| 2019 | $1,884 | $309,700 | $50,000 | $259,700 |
| 2018 | $2,661 | $342,500 | $50,500 | $292,000 |
| 2017 | $2,829 | $374,300 | $39,600 | $334,700 |
| 2016 | $2,453 | $382,100 | $32,600 | $349,500 |
| 2014 | $1,984 | $310,900 | $28,600 | $282,300 |
| 2013 | $1,984 | $314,400 | $28,600 | $285,800 |
Source: Public Records
Map
Nearby Homes
Your Personal Tour Guide
Ask me questions while you tour the home.