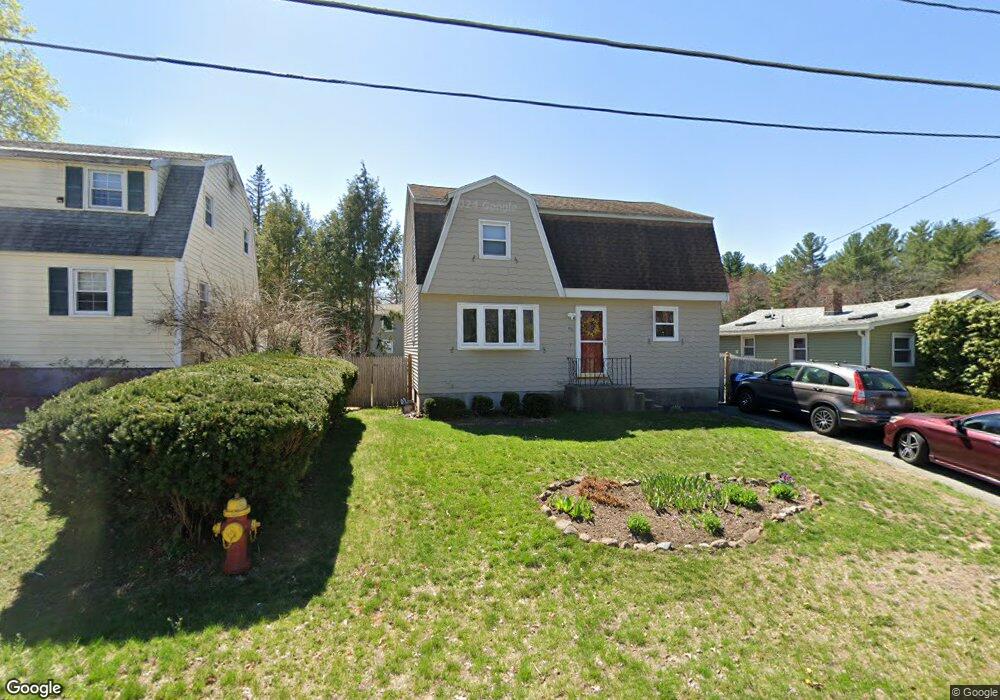
116 Beech St Tewksbury, MA 01876
Estimated Value: $551,770 - $682,000
3
Beds
2
Baths
1,560
Sq Ft
$395/Sq Ft
Est. Value
About This Home
This home is located at 116 Beech St, Tewksbury, MA 01876 and is currently estimated at $615,693, approximately $394 per square foot. 116 Beech St is a home located in Middlesex County with nearby schools including Heath-Brook Elementary School, John W. Wynn Middle School, and John F. Ryan Elementary School.
Ownership History
Date
Name
Owned For
Owner Type
Purchase Details
Closed on
Jul 26, 2021
Sold by
Downing Michael C and Downing Stacy G
Bought by
Downing Ft
Current Estimated Value
Purchase Details
Closed on
Mar 27, 1992
Sold by
Williams Gregory B and Williams Judith
Bought by
Downing Michael C and Downing Stacy
Home Financials for this Owner
Home Financials are based on the most recent Mortgage that was taken out on this home.
Original Mortgage
$117,000
Interest Rate
8.66%
Mortgage Type
Purchase Money Mortgage
Create a Home Valuation Report for This Property
The Home Valuation Report is an in-depth analysis detailing your home's value as well as a comparison with similar homes in the area
Home Values in the Area
Average Home Value in this Area
Purchase History
| Date | Buyer | Sale Price | Title Company |
|---|---|---|---|
| Downing Ft | -- | None Available | |
| Downing Michael C | $132,500 | -- |
Source: Public Records
Mortgage History
| Date | Status | Borrower | Loan Amount |
|---|---|---|---|
| Previous Owner | Downing Michael C | $73,204 | |
| Previous Owner | Downing Michael C | $105,000 | |
| Previous Owner | Downing Michael C | $117,000 | |
| Previous Owner | Downing Michael C | $117,000 |
Source: Public Records
Tax History
| Year | Tax Paid | Tax Assessment Tax Assessment Total Assessment is a certain percentage of the fair market value that is determined by local assessors to be the total taxable value of land and additions on the property. | Land | Improvement |
|---|---|---|---|---|
| 2025 | $6,171 | $466,800 | $223,300 | $243,500 |
| 2024 | $6,039 | $451,000 | $212,600 | $238,400 |
| 2023 | $5,853 | $415,100 | $193,300 | $221,800 |
| 2022 | $5,492 | $361,300 | $168,100 | $193,200 |
| 2021 | $5,294 | $336,800 | $152,800 | $184,000 |
| 2020 | $5,102 | $319,500 | $145,600 | $173,900 |
| 2019 | $4,510 | $284,700 | $138,600 | $146,100 |
| 2018 | $4,234 | $262,500 | $138,600 | $123,900 |
| 2017 | $4,306 | $264,000 | $145,600 | $118,400 |
| 2016 | $4,156 | $254,200 | $145,600 | $108,600 |
| 2015 | $4,076 | $249,000 | $138,600 | $110,400 |
| 2014 | $3,863 | $239,800 | $138,600 | $101,200 |
Source: Public Records
Map
Nearby Homes
- 29 Donald Rd
- 31 George Brown St
- 13 Brookside Dr
- 436 Foster Rd
- 18 Knollwood Rd
- 2 Rhode Island Rd
- 6 3rd St
- 460 Shawsheen Ave
- 33 Pratt St
- 26 Ironwood Ln
- 1 Eagle Dr
- 29 Maplewood Ave
- 18 Brook St
- 143 Foster Rd
- 56 Lake St
- 13 Radcliffe Rd Unit A
- 13 Radcliffe Rd Unit B
- 11 Edgeworth St
- 41 Bridge St
- 3 Memory Ln
Your Personal Tour Guide
Ask me questions while you tour the home.