116 Core Rd Richlands, NC 28574
Estimated Value: $189,000 - $242,000
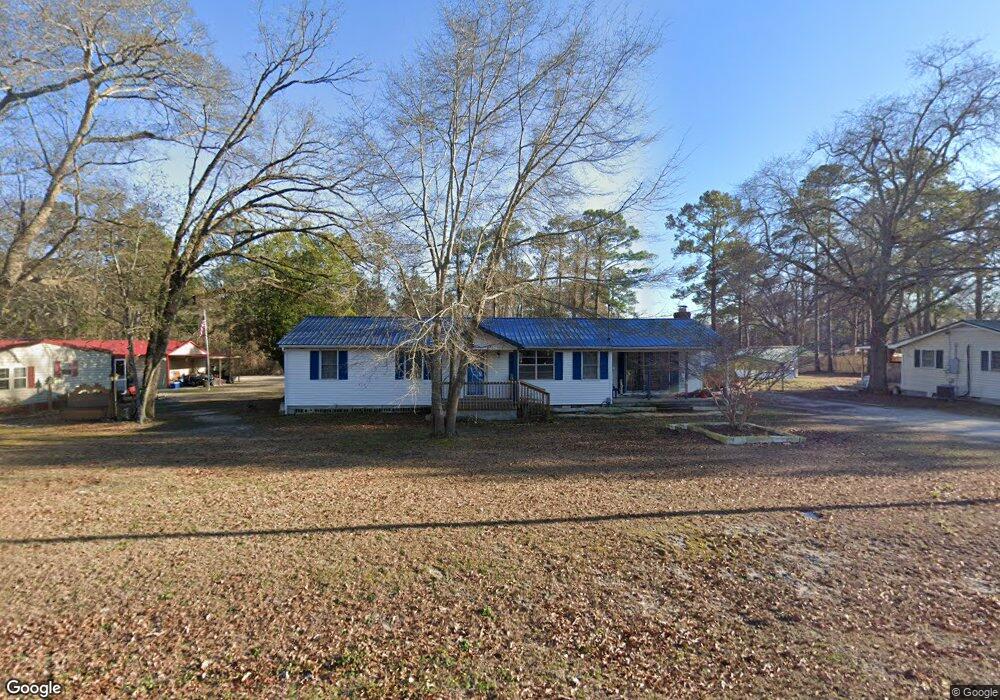
About This Home
This home is located at 116 Core Rd, Richlands, NC 28574 and is currently estimated at $222,107, approximately $149 per square foot. 116 Core Rd is a home located in Onslow County with nearby schools including Richlands Elementary School, Trexler Middle School, and Richlands High School.
Ownership History
We collect this data history from publicly available records. To have your information removed, we recommend requesting removal directly through your county’s website.
Purchase Details
Home Financials for this Owner
Home Financials are based on the most recent Mortgage that was taken out on this home.Home Values in the Area
Average Home Value in this Area
Purchase History
We collect this data history from publicly available records. To have your information removed, we recommend requesting removal directly through your county’s website.
| Date | Buyer | Sale Price | Title Company |
|---|---|---|---|
| $186,000 | None Listed On Document | ||
| $186,000 | None Listed On Document |
Mortgage History
We collect this data history from publicly available records. To have your information removed, we recommend requesting removal directly through your county’s website.
| Date | Status | Borrower | Loan Amount |
|---|---|---|---|
| Open | $185,875 | ||
| Closed | $185,875 |
Tax History
We collect this data history from publicly available records. To have your information removed, we recommend requesting removal directly through your county’s website.
| Year | Tax Paid | Tax Assessment Tax Assessment Total Assessment is a certain percentage of the fair market value that is determined by local assessors to be the total taxable value of land and additions on the property. | Land | Improvement |
|---|---|---|---|---|
| 2025 | $528 | $134,018 | $28,840 | $105,178 |
| 2024 | $528 | $126,435 | $30,000 | $96,435 |
| 2023 | $528 | $126,435 | $30,000 | $96,435 |
| 2022 | $528 | $126,435 | $30,000 | $96,435 |
| 2021 | $443 | $98,810 | $22,000 | $76,810 |
| 2020 | $420 | $98,810 | $22,000 | $76,810 |
| 2019 | $420 | $98,810 | $22,000 | $76,810 |
| 2018 | $420 | $98,810 | $22,000 | $76,810 |
| 2017 | $473 | $109,360 | $25,000 | $84,360 |
| 2016 | $473 | $70,130 | $0 | $0 |
| 2015 | $473 | $70,130 | $0 | $0 |
| 2014 | $473 | $109,360 | $0 | $0 |
Map
- 120 Walnut Hills Dr
- 110 Saint Rd
- 124 Saint Rd
- 126 Saint Rd
- 203 Reef Ln
- 108 Braeburn Blvd
- 124 Braeburn Blvd
- 106 Madelyn Dr
- 108 Madelyn Dr
- 106 Mcclendon Ct
- 459 Fowler Manning Rd
- 467 Fowler Manning Rd
- 469 Fowler Manning Rd
- 200 Essex Ct
- 501 Poults Dr
- 520 Poults Dr
- 103 Old Fountain Rd
- 209 Chokecherry S
- 901 Purvis Ct
- 150 Mattie Ln
- 118 Core Rd
- 122 Core Rd
- 440 Bannermans Mill Rd
- 117 Core Rd
- 111 Core Rd
- 124 Core Rd
- 458 Bannermans Mill Rd
- 123 Core Rd
- 449 Bannermans Mill Rd
- 200 Westfield Dr
- 464 Bannermans Mill Rd
- 131 Core Rd
- 201 Westfield Dr
- 470 Bannermans Mill Rd
- 459 Bannermans Mill Rd
- 455 Bannermans Mill Rd
- 202 Westfield Dr
- 132 Core Rd
- 113 Lizard Ln
- 203 Westfield Dr
Ask me questions while you tour the home.