116 Drake Rd Burlington, MA 01803
North Burlington NeighborhoodEstimated Value: $934,107 - $1,081,000
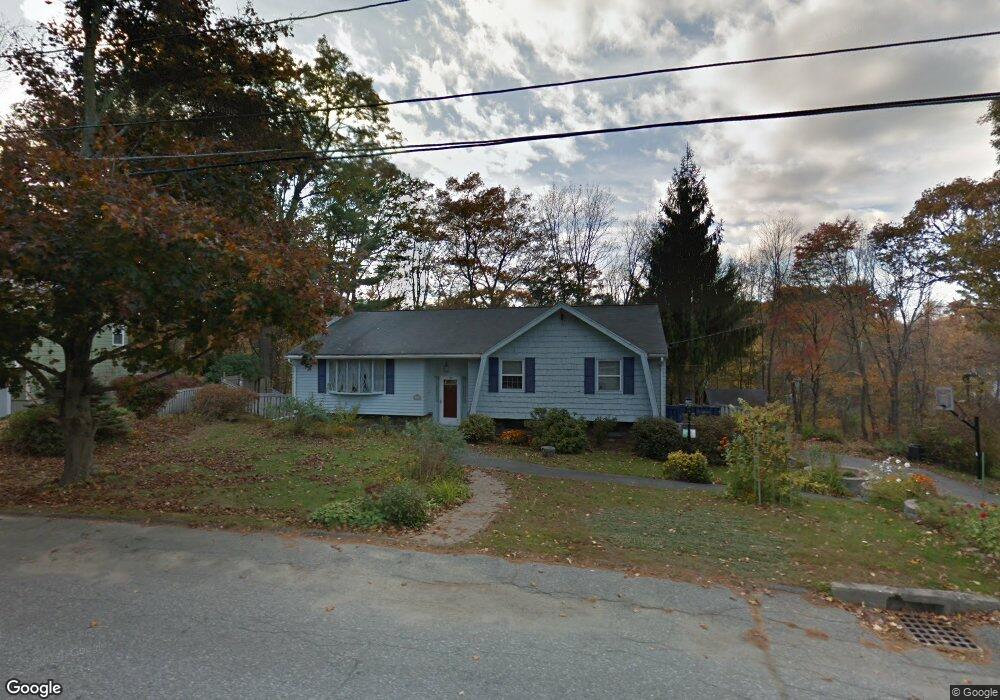
About This Home
This home is located at 116 Drake Rd, Burlington, MA 01803 and is currently estimated at $997,527, approximately $417 per square foot. 116 Drake Rd is a home located in Middlesex County with nearby schools including Burlington High School, Fox Hill, and Marshall Simonds Middle School.
Ownership History
We collect this data history from publicly available records. To have your information removed, we recommend requesting removal directly through your county’s website.
Purchase Details
Purchase Details
Home Values in the Area
Average Home Value in this Area
Purchase History
We collect this data history from publicly available records. To have your information removed, we recommend requesting removal directly through your county’s website.
| Date | Buyer | Sale Price | Title Company |
|---|---|---|---|
| -- | None Available | ||
| -- | None Available | ||
| $235,000 | -- | ||
| $235,000 | -- |
Mortgage History
We collect this data history from publicly available records. To have your information removed, we recommend requesting removal directly through your county’s website.
| Date | Status | Borrower | Loan Amount |
|---|---|---|---|
| Previous Owner | $154,000 | ||
| Previous Owner | $117,500 | ||
| Previous Owner | $119,000 |
Tax History
We collect this data history from publicly available records. To have your information removed, we recommend requesting removal directly through your county’s website.
| Year | Tax Paid | Tax Assessment Tax Assessment Total Assessment is a certain percentage of the fair market value that is determined by local assessors to be the total taxable value of land and additions on the property. | Land | Improvement |
|---|---|---|---|---|
| 2025 | $6,742 | $778,500 | $439,700 | $338,800 |
| 2024 | $6,522 | $729,500 | $401,400 | $328,100 |
| 2023 | $6,283 | $668,400 | $348,200 | $320,200 |
| 2022 | $6,159 | $619,000 | $316,900 | $302,100 |
| 2021 | $8,953 | $603,800 | $301,700 | $302,100 |
| 2020 | $5,774 | $599,000 | $296,900 | $302,100 |
| 2019 | $5,776 | $551,100 | $277,900 | $273,200 |
| 2018 | $6,407 | $519,800 | $277,900 | $241,900 |
| 2017 | $6,069 | $519,800 | $277,900 | $241,900 |
| 2016 | $5,423 | $473,200 | $239,900 | $233,300 |
| 2015 | $5,371 | $473,200 | $239,900 | $233,300 |
| 2014 | $5,118 | $426,500 | $207,600 | $218,900 |
Map
- 35 Freeport Dr
- 22 Susan Ave
- 23 Patriot Rd
- 39 Mill St
- 11 Thornton Dr
- 210 Winn St
- 27 Boulder Dr
- 174 Winn St
- 9 Sparhawk Dr
- 235 Cambridge St Unit 202
- 6 Arthur Woods Ave
- 4 Murray Hill Cir
- 7 Nelson Rd
- 24 Mill Rd
- 10 Hillcrest Rd
- 9 Fernglade Rd
- 4 Lt Litchfield Way
- 7 Alcine Ln
- 29 Bedford St
- 29 Northwoods Cir Unit 29
Ask me questions while you tour the home.