Estimated Value: $108,000 - $157,000
About This Home
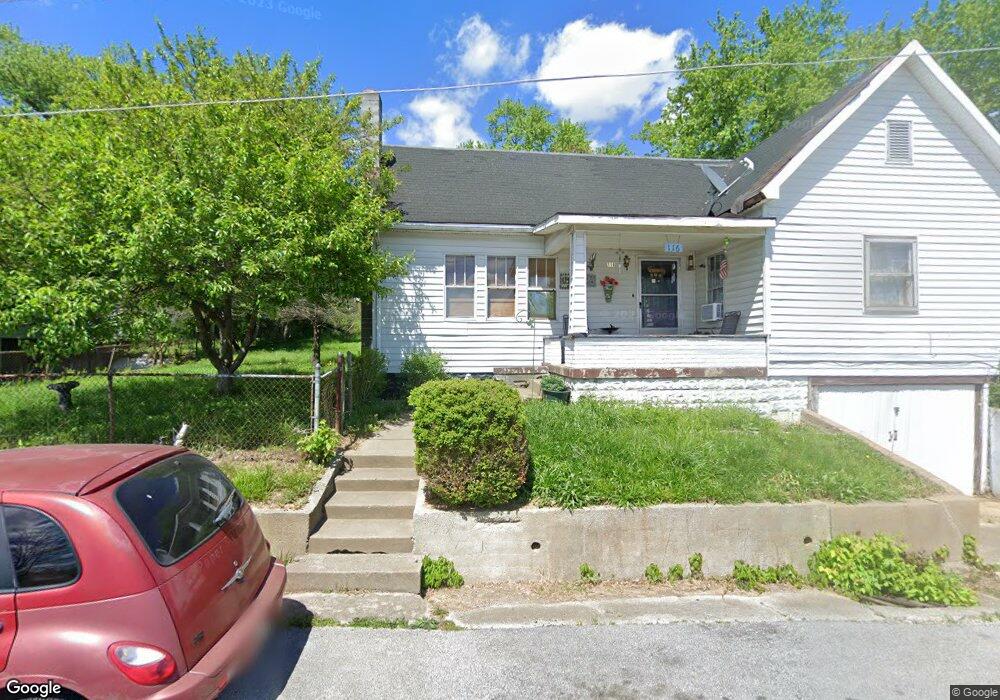
This home is located at 116 E High St, Pekin, IN 47165 and is currently estimated at $130,537, approximately $145 per square foot. 116 E High St is a home located in Washington County with nearby schools including East Washington Elementary School, East Washington Middle School, and Eastern High School.
Ownership History
We collect this data history from publicly available records. To have your information removed, we recommend requesting removal directly through your county’s website.
Purchase Details
Home Financials for this Owner
Home Financials are based on the most recent Mortgage that was taken out on this home.Purchase Details
Purchase Details
Purchase History
We collect this data history from publicly available records. To have your information removed, we recommend requesting removal directly through your county’s website.
| Date | Buyer | Sale Price | Title Company |
|---|---|---|---|
| -- | None Listed On Document | ||
| $50,000 | None Listed On Document | ||
| -- | Classic Title Inc |
Mortgage History
We collect this data history from publicly available records. To have your information removed, we recommend requesting removal directly through your county’s website.
| Date | Status | Borrower | Loan Amount |
|---|---|---|---|
| Open | $130,000 |
Tax History
We collect this data history from publicly available records. To have your information removed, we recommend requesting removal directly through your county’s website.
| Year | Tax Paid | Tax Assessment Tax Assessment Total Assessment is a certain percentage of the fair market value that is determined by local assessors to be the total taxable value of land and additions on the property. | Land | Improvement |
|---|---|---|---|---|
| 2025 | $1,655 | $82,700 | $9,900 | $72,800 |
| 2024 | $1,403 | $70,100 | $9,900 | $60,200 |
| 2023 | $476 | $66,900 | $9,900 | $57,000 |
| 2022 | $425 | $63,300 | $9,900 | $53,400 |
| 2021 | $412 | $59,000 | $9,900 | $49,100 |
| 2020 | $411 | $57,700 | $9,900 | $47,800 |
| 2019 | $393 | $55,900 | $9,900 | $46,000 |
| 2018 | $196 | $38,200 | $9,900 | $28,300 |
| 2017 | $222 | $38,000 | $9,900 | $28,100 |
| 2016 | $174 | $33,200 | $9,900 | $23,300 |
| 2014 | $162 | $32,200 | $8,600 | $23,600 |
| 2013 | $102 | $33,000 | $10,600 | $22,400 |
Map
- 123 E Main St
- 225 E State Road 60
- 350 W Main St
- 800 N Blue River Rd
- 1138 N Renee Ct
- 6872 E Hurst Rd
- 591 S Robbs Ln
- 0 State Road 135 West Side Rd Unit 202607582
- 3250 S Wathen Rd
- 0 N Side of Daily Rd Unit 202608884
- 2980 E Banet Rd
- 1574 W Water St
- 1566 W Water St
- 22106 Daisy Hill Rd
- 3028 S Middle Fork Ln
- 3398 S State Road 60
- 9690 S Voyles Rd
- 0 E Farabee Rd
- 11087 S Trinity Ln
- 1917 E Dutch Creek Rd
Ask me questions while you tour the home.