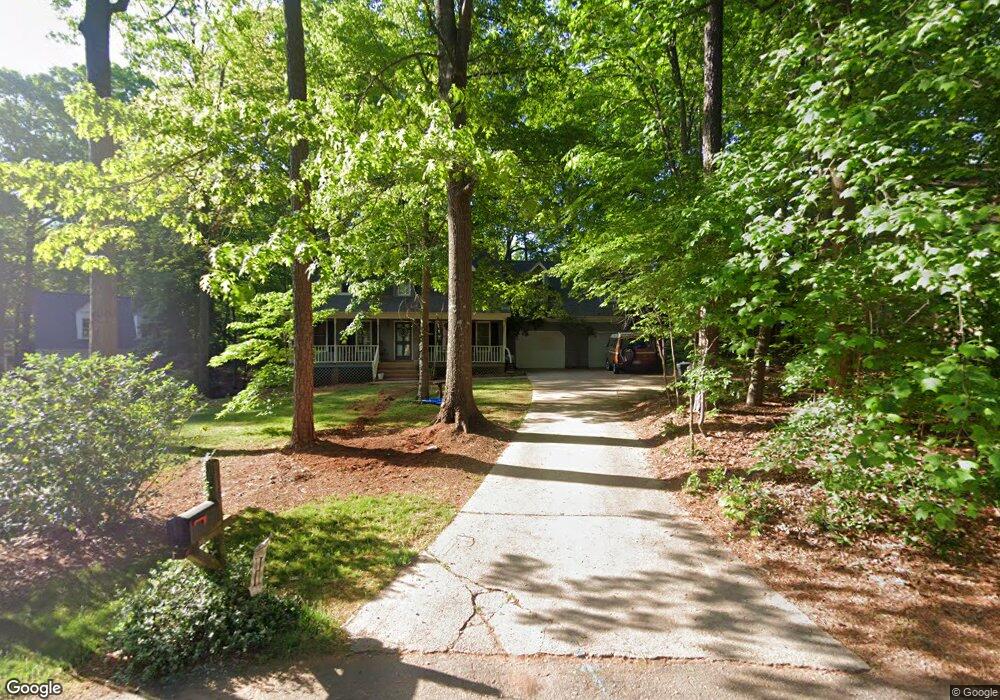
116 Farren Ct Cary, NC 27511
South Cary NeighborhoodEstimated Value: $456,000 - $528,000
About This Home
This home is located at 116 Farren Ct, Cary, NC 27511 and is currently estimated at $492,160, approximately $368 per square foot. 116 Farren Ct is a home located in Wake County with nearby schools including Farmington Woods Elementary, East Cary Middle School, and Cary High School.
Ownership History
We collect this data history from publicly available records. To have your information removed, we recommend requesting removal directly through your county’s website.
Purchase Details
Home Financials for this Owner
Home Financials are based on the most recent Mortgage that was taken out on this home.Purchase Details
Home Values in the Area
Average Home Value in this Area
Purchase History
We collect this data history from publicly available records. To have your information removed, we recommend requesting removal directly through your county’s website.
| Date | Buyer | Sale Price | Title Company |
|---|---|---|---|
| $371,000 | None Available | ||
| $103,500 | -- |
Mortgage History
We collect this data history from publicly available records. To have your information removed, we recommend requesting removal directly through your county’s website.
| Date | Status | Borrower | Loan Amount |
|---|---|---|---|
| Open | $331,000 |
Tax History
We collect this data history from publicly available records. To have your information removed, we recommend requesting removal directly through your county’s website.
| Year | Tax Paid | Tax Assessment Tax Assessment Total Assessment is a certain percentage of the fair market value that is determined by local assessors to be the total taxable value of land and additions on the property. | Land | Improvement |
|---|---|---|---|---|
| 2025 | $4,184 | $485,781 | $210,000 | $275,781 |
| 2024 | $4,093 | $485,781 | $210,000 | $275,781 |
| 2023 | $3,392 | $336,544 | $128,000 | $208,544 |
| 2022 | $3,266 | $336,544 | $128,000 | $208,544 |
| 2021 | $3,200 | $336,544 | $128,000 | $208,544 |
| 2020 | $3,217 | $336,544 | $128,000 | $208,544 |
| 2019 | $2,904 | $269,331 | $110,000 | $159,331 |
| 2018 | $2,725 | $269,331 | $110,000 | $159,331 |
| 2017 | $2,619 | $269,331 | $110,000 | $159,331 |
| 2016 | $2,580 | $269,331 | $110,000 | $159,331 |
| 2015 | $2,344 | $236,009 | $78,000 | $158,009 |
| 2014 | $2,210 | $236,009 | $78,000 | $158,009 |
Map
- 101 Ridgepath Way
- 219 Heidinger Dr
- 1545 Seabrook Ave
- 2004 Clyde Bank Ct Unit 27A
- 102 Shotts Ct
- 1823 Bulon Dr
- 4022 Wellington Ridge Loop
- 110 Overview Ln
- 100 Lively Ct W
- 205 Coventry Ln
- 924 New Kent Place Unit 924
- 914 New Kent Place Unit n/a
- 834 New Kent Place Unit 3D
- 100 Moray Ct
- 105 Dewberry Ct
- 102 Amesbury Ln
- 409 Oakridge Rd
- 1313 Bloomingdale Dr
- 109 Queensferry Rd
- 112 Queensferry Rd
- 118 Farren Ct
- 114 Farren Ct
- 1800 Seabrook Ave
- 212 Dunhagan Place
- 112 Farren Ct
- 109 Farren Ct
- 210 Dunhagan Place
- 1801 Seabrook Ave
- 103 Farren Ct
- 110 Farren Ct
- 105 Farren Ct
- 107 Farren Ct
- 103 Hagan Ct
- 302 Dunhagan Place
- 1726 Seabrook Ave
- 101 Hagan Ct
- 108 Farren Ct
- 213 Dunhagan Place
- 304 Dunhagan Place
- 105 Hagan Ct
Ask me questions while you tour the home.