
Seller's Agent in 2025
Dan Merrigan
Merrigan & Lefebvre Realty
(860) 614-1748
76 in this area
131 Total Sales
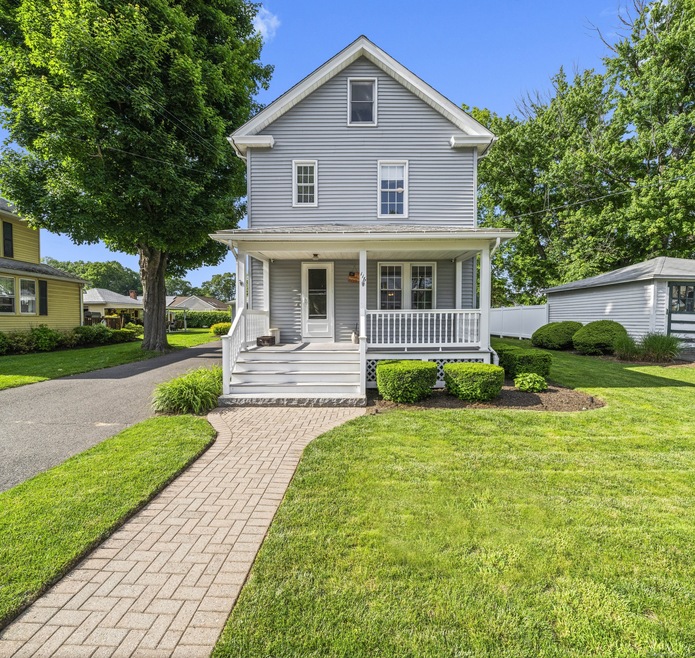
MINT MINT MINT! This four-bedroom Colonial features an open floorplan on the main level connecting the living room, kitchen, and dining areas. The living room has a pellet stove for additional heat on the main level and tiled floor landing/drop area. The kitchen has been remodeled and has Corian counters. There is also a den or could be a more formal dining room behind glass french doors on the main level. Upstairs includes four generous bedrooms, including a primary bedroom with an attached laundry area, remodeled full bathroom also upstairs. The second-floor full bath has been remodeled and has double sinks. The home includes a full basement with approximately 400 sq ft of additional finished space. A full front porch, detached two-car garage. The grounds are professionally landscaped with a large paver block patio, a stone wall around the back perimeter featuring a stone firepit. There is an irrigation system and beautiful mulched beds in the front, back and along the side of the foundation, Additional features include a newer heating system, central A/C, 200-amp electrical service, all thermal windows throughout. Coming soon. Showings begin Wednesday, June 4.
Last Agent to Sell the Property
Merrigan & Lefebvre Realty License #REB.0789576 Listed on: 05/30/2025
| Date | Type | Sale Price | Title Company |
|---|---|---|---|
| Warranty Deed | $375,000 | -- | |
| Warranty Deed | $108,000 | -- | |
| Warranty Deed | $108,000 | -- | |
| Deed | $129,500 | -- |
| Date | Status | Loan Amount | Loan Type |
|---|---|---|---|
| Open | $356,250 | Future Advance Clause Open End Mortgage | |
| Previous Owner | $80,609 | No Value Available | |
| Previous Owner | $92,150 | No Value Available | |
| Previous Owner | $97,000 | Purchase Money Mortgage |
| Date | Event | Price | List to Sale | Price per Sq Ft |
|---|---|---|---|---|
| 07/22/2025 07/22/25 | Sold | $375,000 | -3.8% | $130 / Sq Ft |
| 07/08/2025 07/08/25 | Pending | -- | -- | -- |
| 06/04/2025 06/04/25 | For Sale | $389,900 | -- | $135 / Sq Ft |
| Year | Tax Paid | Tax Assessment Tax Assessment Total Assessment is a certain percentage of the fair market value that is determined by local assessors to be the total taxable value of land and additions on the property. | Land | Improvement |
|---|---|---|---|---|
| 2025 | $6,067 | $252,910 | $51,170 | $201,740 |
| 2024 | $4,077 | $144,900 | $33,600 | $111,300 |
| 2023 | $3,815 | $144,900 | $33,600 | $111,300 |
| 2022 | $3,743 | $144,900 | $33,600 | $111,300 |
| 2021 | $3,743 | $144,900 | $33,600 | $111,300 |
| 2020 | $3,743 | $144,900 | $33,600 | $111,300 |
| 2019 | $3,743 | $144,900 | $33,600 | $111,300 |
| 2017 | $3,551 | $133,200 | $32,300 | $100,900 |
| 2016 | $3,551 | $133,200 | $32,300 | $100,900 |
| 2015 | $3,568 | $133,200 | $32,300 | $100,900 |
| 2014 | $4,105 | $156,500 | $36,700 | $119,800 |
Seller's Agent in 2025
Dan Merrigan
Merrigan & Lefebvre Realty
(860) 614-1748
76 in this area
131 Total Sales
Buyer's Agent in 2025
Dan Babich
REMAX Revolution
(860) 212-8680
2 in this area
32 Total Sales
Source: SmartMLS
MLS Number: 24100094
APN: WINL-000028-000050-000029
Disclaimer: Certain information contained herein is derived from information provided by parties other than Homes.com. All information provided is deemed reliable, but is not guaranteed to be accurate and should be independently verified.
![]() IDX information is provided exclusively for personal, non-commercial use, and may not be used for any purpose other than to identify prospective properties consumers may be interested in purchasing. Information is deemed reliable but not guaranteed.
IDX information is provided exclusively for personal, non-commercial use, and may not be used for any purpose other than to identify prospective properties consumers may be interested in purchasing. Information is deemed reliable but not guaranteed.
Ask me questions while you tour the home.