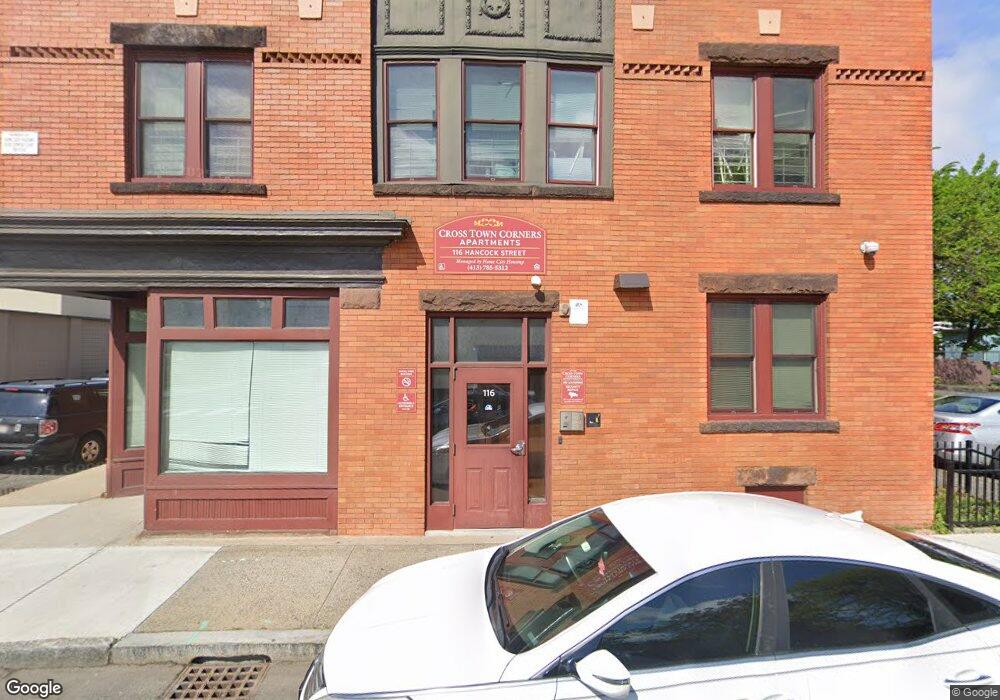
116 Hancock St Unit 118 Springfield, MA 01109
Old Hill NeighborhoodEstimated Value: $399,730
About This Home
This home is located at 116 Hancock St Unit 118, Springfield, MA 01109 and is currently estimated at $399,730, approximately $28 per square foot. 116 Hancock St Unit 118 is a home located in Hampden County with nearby schools including William N. DeBerry Elementary School, M Marcus Kiley Middle, and High School Of Commerce.
Ownership History
We collect this data history from publicly available records. To have your information removed, we recommend requesting removal directly through your county’s website.
Purchase Details
Home Financials for this Owner
Home Financials are based on the most recent Mortgage that was taken out on this home.Purchase Details
Purchase Details
Home Values in the Area
Average Home Value in this Area
Purchase History
We collect this data history from publicly available records. To have your information removed, we recommend requesting removal directly through your county’s website.
| Date | Buyer | Sale Price | Title Company |
|---|---|---|---|
| -- | -- | ||
| -- | -- | ||
| $1,337,825 | -- | ||
| $1,337,825 | -- | ||
| $132,000 | -- |
Mortgage History
We collect this data history from publicly available records. To have your information removed, we recommend requesting removal directly through your county’s website.
| Date | Status | Borrower | Loan Amount |
|---|---|---|---|
| Open | $4,250,000 | ||
| Closed | $0 | ||
| Closed | $2,735,152 | ||
| Previous Owner | $240,000 |
Tax History
We collect this data history from publicly available records. To have your information removed, we recommend requesting removal directly through your county’s website.
| Year | Tax Paid | Tax Assessment Tax Assessment Total Assessment is a certain percentage of the fair market value that is determined by local assessors to be the total taxable value of land and additions on the property. | Land | Improvement |
|---|---|---|---|---|
| 2025 | -- | $470,300 | $165,000 | $305,300 |
| 2024 | -- | $378,000 | $154,000 | $224,000 |
| 2023 | $0 | $391,100 | $100,100 | $291,000 |
| 2022 | $0 | $394,400 | $71,500 | $322,900 |
| 2021 | $0 | $319,600 | $71,500 | $248,100 |
| 2020 | $11,514 | $539,800 | $71,500 | $468,300 |
| 2019 | $11,184 | $543,000 | $71,500 | $471,500 |
| 2018 | $0 | $526,600 | $71,500 | $455,100 |
| 2017 | $0 | $515,000 | $71,500 | $443,500 |
| 2016 | -- | $474,000 | $71,500 | $402,500 |
| 2015 | -- | $432,800 | $71,500 | $361,300 |
Map
- 88 Tyler St
- 658 Union St
- 540-542 Union St
- 536-538 Union St
- 148-150 Cedar St
- 199 Eastern Ave
- 36-38 Chapel St
- 64 Thompson St
- 93 Thompson St
- 435 State St
- 115-117 Northampton Ave
- 101 Mulberry St Unit G3
- 101 Mulberry St Unit 314
- 20 Crosby St
- 48 Madison Ave
- 21 Westford Cir
- 54 Ridgewood Place
- 229 Central St
- 49 Andrew St
- 158 Bowles St
- 288 Tyler St
- 0 Tyler St
- 118 Tyler St
- 106 Hancock St Unit 108
- 116 Tyler St
- 101 Hancock St
- 119 Quincy St
- 110 Tyler St Unit 112
- 110-112 Tyler St
- 117 Tyler St
- 121 Tyler St
- 97 Hancock St
- 115 Quincy St Unit 117
- 115-117 Quincy St
- 106 Tyler St
- 154 Tyler St
- 93 Hancock St
- 107 Tyler St Unit 1
- 107 Tyler St Unit 2
- 94-96 Hancock St
Ask me questions while you tour the home.