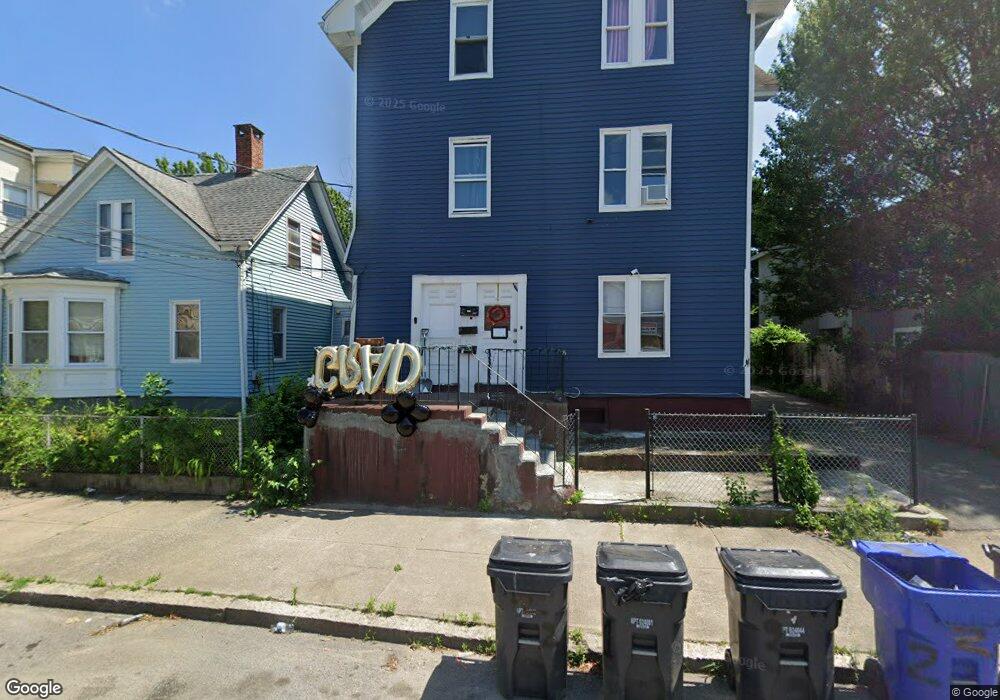
116 Magill St Pawtucket, RI 02860
Woodlawn NeighborhoodEstimated Value: $638,000 - $753,000
9
Beds
3
Baths
3,844
Sq Ft
$177/Sq Ft
Est. Value
About This Home
This home is located at 116 Magill St, Pawtucket, RI 02860 and is currently estimated at $680,333, approximately $176 per square foot. 116 Magill St is a home located in Providence County with nearby schools including International Charter School, Blackstone Valley Prep Junior High School, and Blackstone Academy Charter School.
Ownership History
Date
Name
Owned For
Owner Type
Purchase Details
Closed on
Feb 1, 2016
Sold by
Pine St Realty Llc
Bought by
Pine St Realty Delawar
Current Estimated Value
Home Financials for this Owner
Home Financials are based on the most recent Mortgage that was taken out on this home.
Original Mortgage
$600,000
Outstanding Balance
$472,224
Interest Rate
3.97%
Mortgage Type
Credit Line Revolving
Estimated Equity
$208,109
Purchase Details
Closed on
Nov 29, 2011
Sold by
Fnma
Bought by
Vo Thao T
Purchase Details
Closed on
Oct 12, 2011
Sold by
Ramirez Miguel A
Bought by
Federal National Mortgage Association
Create a Home Valuation Report for This Property
The Home Valuation Report is an in-depth analysis detailing your home's value as well as a comparison with similar homes in the area
Home Values in the Area
Average Home Value in this Area
Purchase History
We collect this data history from publicly available records. To have your information removed, we recommend requesting removal directly through your county’s website.
| Date | Buyer | Sale Price | Title Company |
|---|---|---|---|
| Pine St Realty Delawar | -- | -- | |
| Vo Thao T | $86,000 | -- | |
| Federal National Mortgage Association | -- | -- |
Source: Public Records
Mortgage History
We collect this data history from publicly available records. To have your information removed, we recommend requesting removal directly through your county’s website.
| Date | Status | Borrower | Loan Amount |
|---|---|---|---|
| Open | Pine St Realty Delawar | $600,000 | |
| Previous Owner | Federal National Mortgage Association | $133,868 | |
| Previous Owner | Federal National Mortgage Association | $52,000 |
Source: Public Records
Tax History
| Year | Tax Paid | Tax Assessment Tax Assessment Total Assessment is a certain percentage of the fair market value that is determined by local assessors to be the total taxable value of land and additions on the property. | Land | Improvement |
|---|---|---|---|---|
| 2025 | $6,810 | $517,900 | $118,600 | $399,300 |
| 2024 | $6,391 | $517,900 | $118,600 | $399,300 |
| 2023 | $6,041 | $356,600 | $53,400 | $303,200 |
| 2022 | $5,912 | $356,600 | $53,400 | $303,200 |
| 2021 | $5,912 | $356,600 | $53,400 | $303,200 |
| 2020 | $4,750 | $227,400 | $54,100 | $173,300 |
| 2019 | $4,750 | $227,400 | $54,100 | $173,300 |
| 2018 | $4,578 | $227,400 | $54,100 | $173,300 |
| 2017 | $4,396 | $193,500 | $41,100 | $152,400 |
| 2016 | $4,236 | $193,500 | $41,100 | $152,400 |
| 2015 | $4,236 | $193,500 | $41,100 | $152,400 |
| 2014 | $3,572 | $154,900 | $52,900 | $102,000 |
Source: Public Records
Map
Nearby Homes
- 187 Sisson St
- 41 Utton Ave
- 135 Boutwell St
- 159 Dunnell Ave
- 147 Warren Ave
- 37 Webb St
- 64 Harvard St
- 133 Trenton St
- 50 Jefferson Ave
- 41 Campbell Terrace
- 14 Kimball Ave
- 25 Blodgett Ave
- 48 Waldo St
- 48 Whipple St
- 76 Slater St
- 138 Garden St
- 31 Bagley St
- 193 Harrison St
- 188 Mineral Spring Ave
- 167 George St
Your Personal Tour Guide
Ask me questions while you tour the home.