116 Main St Salisbury, MA 01952
Estimated Value: $616,731 - $854,000
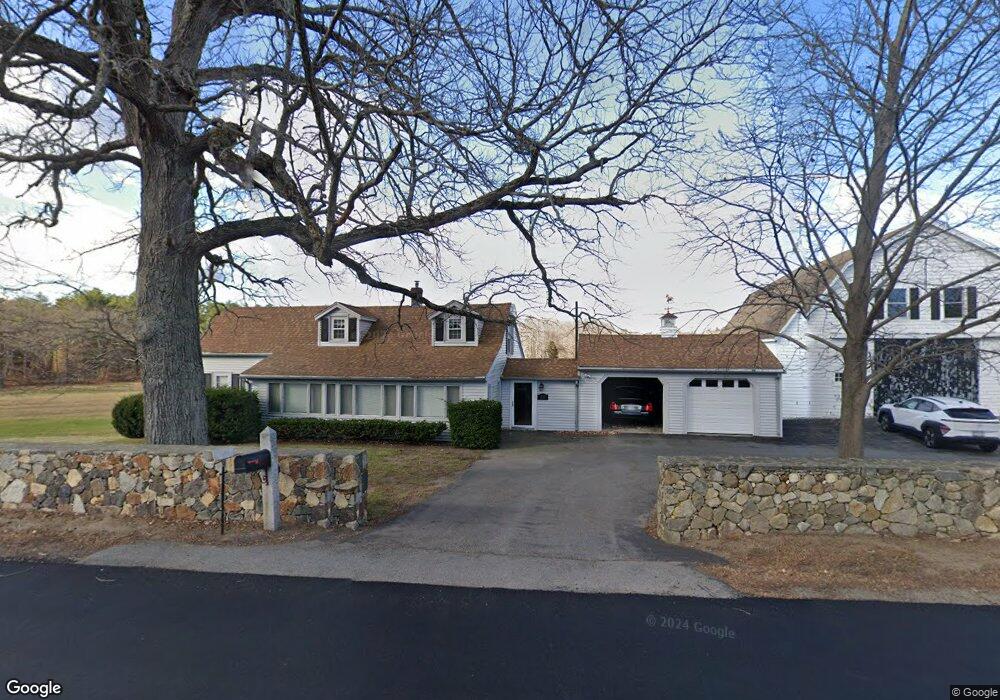
About This Home
This home is located at 116 Main St, Salisbury, MA 01952 and is currently estimated at $742,683, approximately $319 per square foot. 116 Main St is a home located in Essex County with nearby schools including Triton Regional High School and Amesbury Seventh-Day Adventist School.
Ownership History
We collect this data history from publicly available records. To have your information removed, we recommend requesting removal directly through your county’s website.
Purchase Details
Purchase Details
Purchase Details
Home Values in the Area
Average Home Value in this Area
Purchase History
We collect this data history from publicly available records. To have your information removed, we recommend requesting removal directly through your county’s website.
| Date | Buyer | Sale Price | Title Company |
|---|---|---|---|
| -- | -- | ||
| -- | -- | ||
| -- | -- |
Mortgage History
We collect this data history from publicly available records. To have your information removed, we recommend requesting removal directly through your county’s website.
| Date | Status | Borrower | Loan Amount |
|---|---|---|---|
| Previous Owner | $250,000 |
Tax History
We collect this data history from publicly available records. To have your information removed, we recommend requesting removal directly through your county’s website.
| Year | Tax Paid | Tax Assessment Tax Assessment Total Assessment is a certain percentage of the fair market value that is determined by local assessors to be the total taxable value of land and additions on the property. | Land | Improvement |
|---|---|---|---|---|
| 2025 | $4,714 | $467,700 | $175,000 | $292,700 |
| 2024 | $4,625 | $442,600 | $175,000 | $267,600 |
| 2023 | $4,549 | $421,200 | $175,000 | $246,200 |
| 2022 | $4,364 | $391,700 | $159,800 | $231,900 |
| 2021 | $4,317 | $383,400 | $159,800 | $223,600 |
| 2020 | $4,167 | $363,600 | $159,800 | $203,800 |
| 2019 | $4,232 | $356,800 | $160,500 | $196,300 |
| 2018 | $4,127 | $350,300 | $160,500 | $189,800 |
| 2017 | $3,774 | $316,600 | $138,700 | $177,900 |
| 2016 | $3,618 | $310,000 | $132,100 | $177,900 |
| 2015 | $3,550 | $302,100 | $131,400 | $170,700 |
Map
- 54 Rabbit Rd
- 6 Monroe St
- 5 & 7 Toll Rd
- 8 Portsmouth Rd
- 26 Back River Rd
- 5 Cushing St
- 11 Colchester St
- 4a Congress St Unit 3
- 163 Elm St Unit 1
- 25 Cedar St Unit 14
- 25 Cedar St Unit 3
- 25 Cedar St Unit 17
- 6 Palis Dr
- 12 Baker Rd
- 25 Clark's Rd Unit 101
- 21 Clarks Rd Unit 204
- 191 Elm St
- 54 Old Merrill St
- 101 Market St Unit B
- 60 Market St
Ask me questions while you tour the home.