116 Summit St Hyde Park, MA 02136
Hyde Park NeighborhoodEstimated Value: $905,000 - $1,093,000
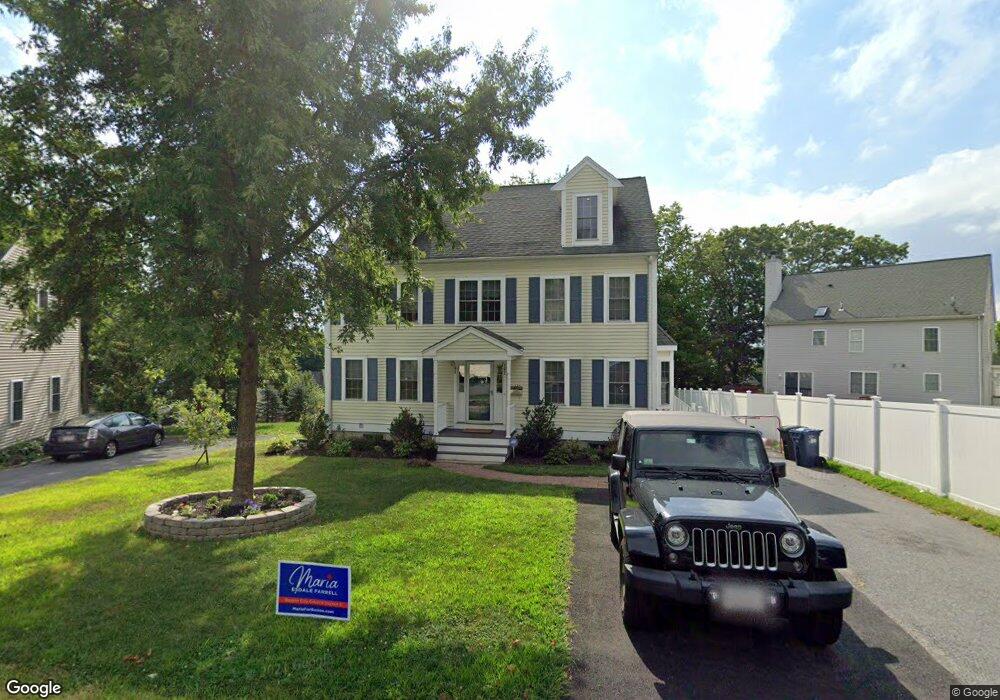
About This Home
This home is located at 116 Summit St, Hyde Park, MA 02136 and is currently estimated at $992,448, approximately $472 per square foot. 116 Summit St is a home located in Suffolk County with nearby schools including Charles H. Taylor Elementary School, Beethoven Elementary School, and Blackstone Elementary.
Ownership History
We collect this data history from publicly available records. To have your information removed, we recommend requesting removal directly through your county’s website.
Purchase Details
Purchase Details
Purchase Details
Home Values in the Area
Average Home Value in this Area
Purchase History
We collect this data history from publicly available records. To have your information removed, we recommend requesting removal directly through your county’s website.
| Date | Buyer | Sale Price | Title Company |
|---|---|---|---|
| -- | None Available | ||
| -- | -- | ||
| $335,000 | -- |
Mortgage History
We collect this data history from publicly available records. To have your information removed, we recommend requesting removal directly through your county’s website.
| Date | Status | Borrower | Loan Amount |
|---|---|---|---|
| Previous Owner | $100,000 |
Tax History
We collect this data history from publicly available records. To have your information removed, we recommend requesting removal directly through your county’s website.
| Year | Tax Paid | Tax Assessment Tax Assessment Total Assessment is a certain percentage of the fair market value that is determined by local assessors to be the total taxable value of land and additions on the property. | Land | Improvement |
|---|---|---|---|---|
| 2025 | $10,712 | $925,000 | $319,100 | $605,900 |
| 2024 | $9,795 | $898,600 | $297,200 | $601,400 |
| 2023 | $9,651 | $898,600 | $297,200 | $601,400 |
| 2022 | $9,057 | $832,400 | $275,300 | $557,100 |
| 2021 | $8,106 | $759,700 | $254,900 | $504,800 |
| 2020 | $6,782 | $642,200 | $234,600 | $407,600 |
| 2019 | $6,325 | $600,100 | $191,900 | $408,200 |
| 2018 | $6,167 | $588,500 | $191,900 | $396,600 |
| 2017 | $6,232 | $588,500 | $191,900 | $396,600 |
| 2016 | $5,781 | $525,500 | $191,900 | $333,600 |
| 2015 | $6,109 | $504,500 | $158,000 | $346,500 |
| 2014 | $6,222 | $494,600 | $158,000 | $336,600 |
Map
- 35 Pond St
- 71 Neponset Ave Unit 1
- 50 Neponset Ave
- 86 Milton Ave
- 6 Kinsale Ln
- 8 Loring Place Unit 8
- 9 Spring Hill Rd
- 755-759 Truman Pkwy
- 46 Beacon St Unit 3
- 71 Tyler St
- 8 Pine St Unit 4
- 33 Oak St
- 34 Oak St Unit 103
- 34 Oak St Unit 202
- 34 Oak St Unit 102
- 34 Oak St Unit 101
- 34 Oak St Unit 303
- 995 Brush Hill Rd
- 17 Landon Rd
- 1110 River St
- 118 Summit St
- 120 Summit St
- 27 Skyline Rd
- 106 Williams Ave
- 102 Williams Ave
- 124 Summit St
- 110 Williams Ave
- 23 Skyline Rd
- 100 Williams Ave
- 122 Summit St
- 128 Summit St
- 114 Summit St
- 15 Leseur Rd
- 19 Skyline Rd
- 132 Summit St
- 132 Summit St Unit 2
- 132 Summit St Unit 1
- 92 Mount Pleasant St Unit 2
- 14 Skyline Rd
- 110 Summit St
Ask me questions while you tour the home.