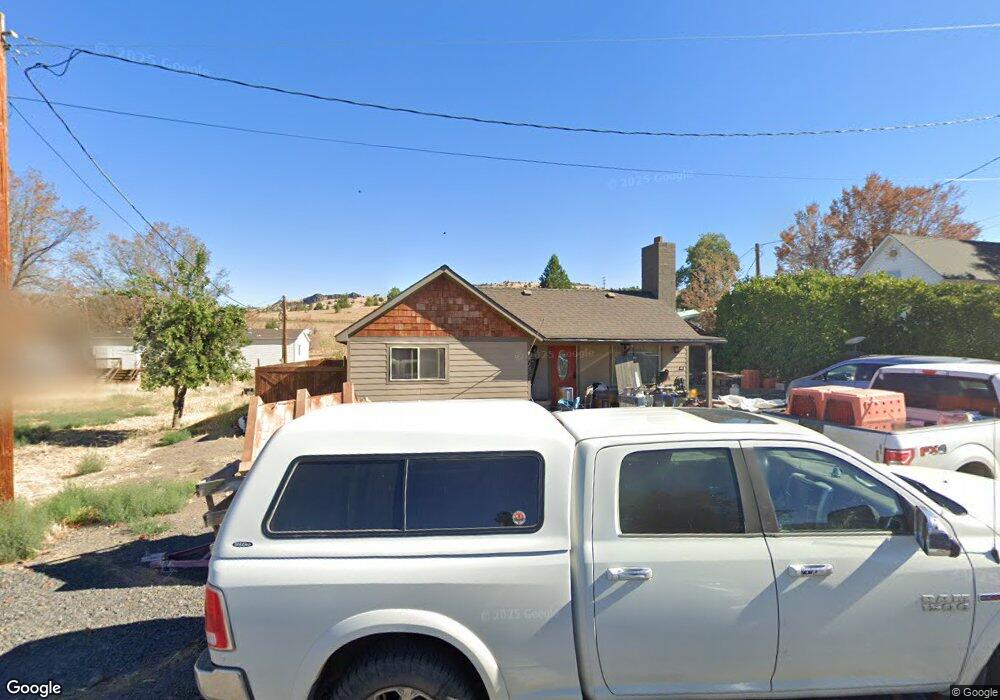
1160 C St Fossil, OR 97830
Estimated Value: $184,542 - $256,000
2
Beds
1
Bath
1,200
Sq Ft
$183/Sq Ft
Est. Value
About This Home
This home is located at 1160 C St, Fossil, OR 97830 and is currently estimated at $219,386, approximately $182 per square foot. 1160 C St is a home located in Wheeler County with nearby schools including Fossil Charter School.
Ownership History
Date
Name
Owned For
Owner Type
Purchase Details
Closed on
Jun 9, 2025
Sold by
Kelsay Stillman
Bought by
Stockton Stephanie A
Current Estimated Value
Home Financials for this Owner
Home Financials are based on the most recent Mortgage that was taken out on this home.
Original Mortgage
$211,105
Outstanding Balance
$209,826
Interest Rate
6.81%
Mortgage Type
FHA
Estimated Equity
$9,560
Purchase Details
Closed on
Dec 15, 2020
Sold by
Rutherford Travis S
Bought by
Kelsay Stillman and Stillman Micah
Purchase Details
Closed on
May 21, 2001
Sold by
Julian Obryant and Julian Evelyn E
Bought by
Rutherford Travis S
Create a Home Valuation Report for This Property
The Home Valuation Report is an in-depth analysis detailing your home's value as well as a comparison with similar homes in the area
Purchase History
| Date | Buyer | Sale Price | Title Company |
|---|---|---|---|
| Stockton Stephanie A | $215,000 | Amerititle | |
| Stockton Stephanie A | $215,000 | Amerititle | |
| Kelsay Stillman | $135,000 | -- | |
| Rutherford Travis S | $55,000 | -- |
Source: Public Records
Mortgage History
| Date | Status | Borrower | Loan Amount |
|---|---|---|---|
| Open | Stockton Stephanie A | $211,105 | |
| Closed | Stockton Stephanie A | $211,105 |
Source: Public Records
Tax History
| Year | Tax Paid | Tax Assessment Tax Assessment Total Assessment is a certain percentage of the fair market value that is determined by local assessors to be the total taxable value of land and additions on the property. | Land | Improvement |
|---|---|---|---|---|
| 2025 | $2,146 | $93,930 | -- | -- |
| 2024 | $2,088 | $91,200 | -- | -- |
| 2023 | $2,032 | $88,550 | $0 | $0 |
| 2022 | $1,863 | $85,974 | $0 | $0 |
| 2021 | $1,357 | $81,330 | $0 | $0 |
| 2020 | $1,350 | $80,695 | $0 | $0 |
| 2019 | $1,171 | $69,861 | $0 | $0 |
| 2018 | $1,194 | $71,322 | $0 | $0 |
| 2017 | $1,351 | $75,189 | $0 | $0 |
| 2016 | $1,351 | $67,860 | $0 | $0 |
Source: Public Records
Map
Nearby Homes
- 1225 B St
- 955 B St
- 406 Ellsworth St
- 404 W 2nd St
- 1270 Washington St
- 46457 Highway 218
- 46457 46459 Hwy 218
- 0 E Badger Canyon Rd Unit 220213330
- 0 E Badger Canyon Rd Unit 655770689
- Badger Canyon Rd
- 39968 Highway 218
- 503 S Washington St
- 303 W Court St
- 0 S Bryan St
- 112 N Oregon St
- 200 Cottonwood Ln
- 000 Lonerock
- 14853 Mt View Dr
- 40300 Kahler Basin Rd
- 303 Pine Ave
Your Personal Tour Guide
Ask me questions while you tour the home.