11643 Moran St Unit Bldg-Unit HamtraMcK, MI 48212
Estimated Value: $209,000 - $257,000
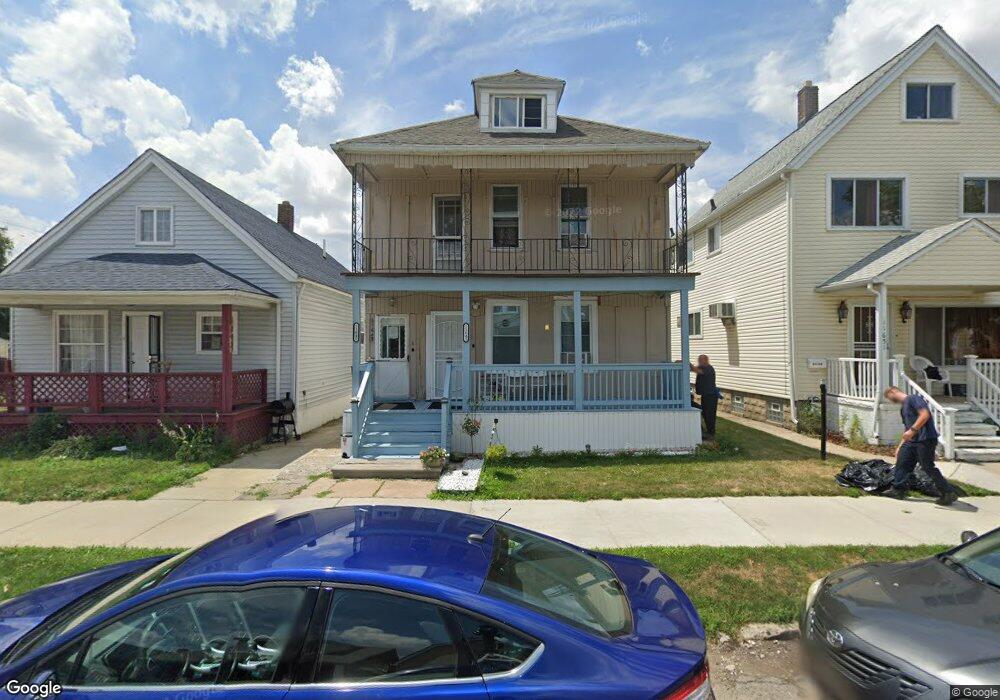
About This Home
This home is located at 11643 Moran St Unit Bldg-Unit, HamtraMcK, MI 48212 and is currently estimated at $230,551, approximately $133 per square foot. 11643 Moran St Unit Bldg-Unit is a home located in Wayne County with nearby schools including Dickinson East Elementary School, Kosciuszko Middle School, and Hamtramck High School.
Ownership History
We collect this data history from publicly available records. To have your information removed, we recommend requesting removal directly through your county’s website.
Purchase Details
Purchase Details
Home Financials for this Owner
Home Financials are based on the most recent Mortgage that was taken out on this home.Purchase Details
Home Values in the Area
Average Home Value in this Area
Purchase History
We collect this data history from publicly available records. To have your information removed, we recommend requesting removal directly through your county’s website.
| Date | Buyer | Sale Price | Title Company |
|---|---|---|---|
| $92,000 | None Listed On Document | ||
| $92,000 | None Available | ||
| $55,000 | -- |
Mortgage History
We collect this data history from publicly available records. To have your information removed, we recommend requesting removal directly through your county’s website.
| Date | Status | Borrower | Loan Amount |
|---|---|---|---|
| Previous Owner | $57,000 |
Tax History
We collect this data history from publicly available records. To have your information removed, we recommend requesting removal directly through your county’s website.
| Year | Tax Paid | Tax Assessment Tax Assessment Total Assessment is a certain percentage of the fair market value that is determined by local assessors to be the total taxable value of land and additions on the property. | Land | Improvement |
|---|---|---|---|---|
| 2025 | $2,871 | $105,400 | $0 | $0 |
| 2024 | $2,819 | $90,000 | $0 | $0 |
| 2023 | $3,167 | $81,600 | $0 | $0 |
| 2022 | $2,754 | $67,100 | $0 | $0 |
| 2021 | $3,059 | $52,700 | $0 | $0 |
| 2020 | $3,033 | $45,800 | $0 | $0 |
| 2019 | $1,503 | $37,500 | $0 | $0 |
| 2018 | $1,227 | $31,100 | $0 | $0 |
| 2017 | $474 | $21,600 | $0 | $0 |
| 2016 | $1,424 | $19,200 | $0 | $0 |
| 2015 | $1,870 | $18,700 | $0 | $0 |
| 2013 | $1,860 | $18,600 | $0 | $0 |
| 2012 | $1,422 | $20,800 | $3,400 | $17,400 |
Map
- 11809 Conant St
- 11603 Klinger St
- 11690 Gallagher St
- 11418 Sobieski St
- 5431, 5419 & 5420 E Davison St E
- 11357 Moran St
- 13015 Conant
- 12099 Klinger St
- 12091 Sobieski St
- 11412 Mcdougall St
- 3935 Caely St
- 4994 Carpenter Ave
- 3237 Trowbridge St
- 5021 Talbot St
- 3929 Caniff St
- 5033 Harold St
- 11685 Mitchell St
- 12309 Klinger St
- 5045 Caniff St
- 12153 Mcdougall St
- 11643 Moran St
- 11657 Moran St
- 11661 Moran St
- 11639 Moran St
- 11667 Moran St
- 11650 Klinger St
- 11627 Moran St
- 11644 Klinger St
- 11654 Klinger St
- 11673 Moran St
- 11660 Klinger St
- 11636 Klinger St
- 11666 Klinger St
- 11632 Klinger St
- 11650 Moran St
- 11681 Moran St
- 11654 Moran St
- 11644 Moran St
- 11638 Moran St
- 11660 Moran St
Ask me questions while you tour the home.