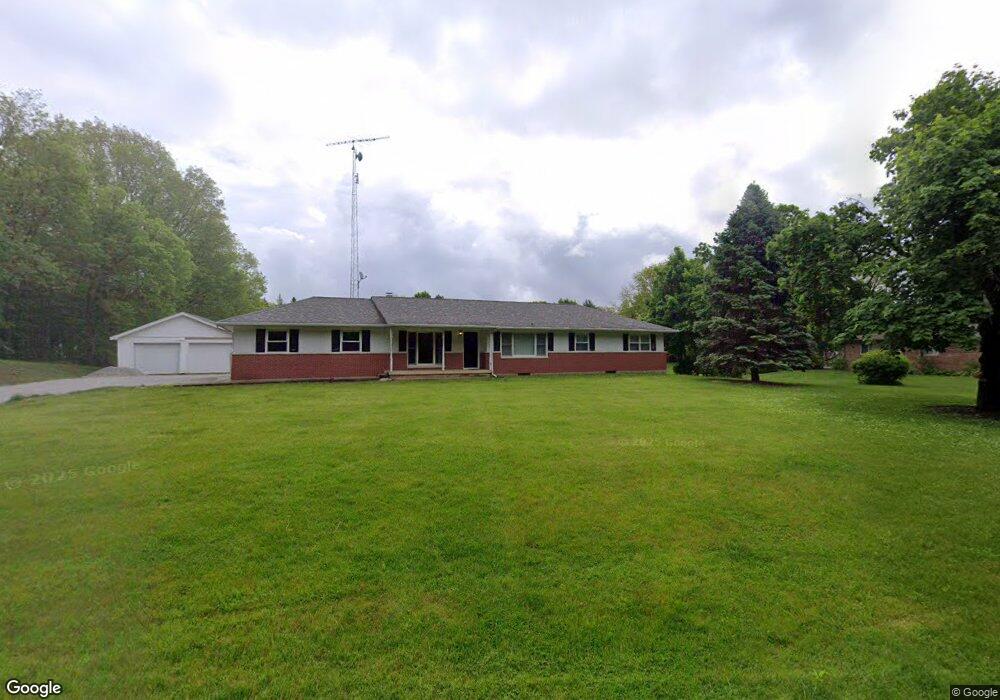
11689 S 400 W Converse, IN 46919
Estimated Value: $237,303 - $285,000
3
Beds
2
Baths
1,476
Sq Ft
$173/Sq Ft
Est. Value
About This Home
This home is located at 11689 S 400 W, Converse, IN 46919 and is currently estimated at $255,768, approximately $173 per square foot. 11689 S 400 W is a home located in Wabash County.
Ownership History
Date
Name
Owned For
Owner Type
Purchase Details
Closed on
Feb 28, 2020
Sold by
Gentry Brian D and Reed Kendal
Bought by
Gentry Brian D and Gentry Kendal
Current Estimated Value
Home Financials for this Owner
Home Financials are based on the most recent Mortgage that was taken out on this home.
Original Mortgage
$159,000
Interest Rate
3.6%
Mortgage Type
Construction
Purchase Details
Closed on
Nov 9, 2016
Sold by
Craig Julaine E
Bought by
Reed Kendal and Gentry Brian D
Home Financials for this Owner
Home Financials are based on the most recent Mortgage that was taken out on this home.
Original Mortgage
$123,405
Interest Rate
3.42%
Mortgage Type
Future Advance Clause Open End Mortgage
Create a Home Valuation Report for This Property
The Home Valuation Report is an in-depth analysis detailing your home's value as well as a comparison with similar homes in the area
Purchase History
We collect this data history from publicly available records. To have your information removed, we recommend requesting removal directly through your county’s website.
| Date | Buyer | Sale Price | Title Company |
|---|---|---|---|
| Gentry Brian D | -- | None Available | |
| Reed Kendal | -- | None Available |
Source: Public Records
Mortgage History
We collect this data history from publicly available records. To have your information removed, we recommend requesting removal directly through your county’s website.
| Date | Status | Borrower | Loan Amount |
|---|---|---|---|
| Closed | Gentry Brian D | $159,000 | |
| Closed | Reed Kendal | $123,405 |
Source: Public Records
Tax History
| Year | Tax Paid | Tax Assessment Tax Assessment Total Assessment is a certain percentage of the fair market value that is determined by local assessors to be the total taxable value of land and additions on the property. | Land | Improvement |
|---|---|---|---|---|
| 2025 | $1,000 | $222,800 | $22,000 | $200,800 |
| 2024 | $1,000 | $178,200 | $22,000 | $156,200 |
| 2023 | $927 | $170,700 | $22,000 | $148,700 |
| 2022 | $716 | $160,200 | $22,000 | $138,200 |
| 2021 | $656 | $140,200 | $18,200 | $122,000 |
| 2020 | $608 | $136,100 | $18,300 | $117,800 |
| 2019 | $566 | $134,200 | $18,300 | $115,900 |
| 2018 | $544 | $130,500 | $18,300 | $112,200 |
| 2017 | $523 | $129,300 | $18,300 | $111,000 |
| 2016 | $171 | $127,800 | $15,500 | $112,300 |
| 2014 | $113 | $129,300 | $15,500 | $113,800 |
| 2013 | $120 | $126,700 | $15,500 | $111,200 |
Source: Public Records
Map
Nearby Homes
- 75 W Old Trail
- 100 N Delaware Ln
- 15 S Second St
- 1870 W Slocum Lot 5 Trail
- 747 W 700 N-27
- 8195 S 300 W
- 6166 Frances Slocum Trail
- 106 W Water St
- 113 N Washington St
- 308 S Main St
- 40 Howard St
- 37 Howard St
- 8540 W Delphi Pike
- 9673 S 200 E
- 9612 Indiana 19
- 5333 Bechtel Ct
- 5317 Bechtel Ct
- 5546 E Vine St
- 3576 W 505 N
- 5984 E 325 S
Your Personal Tour Guide
Ask me questions while you tour the home.