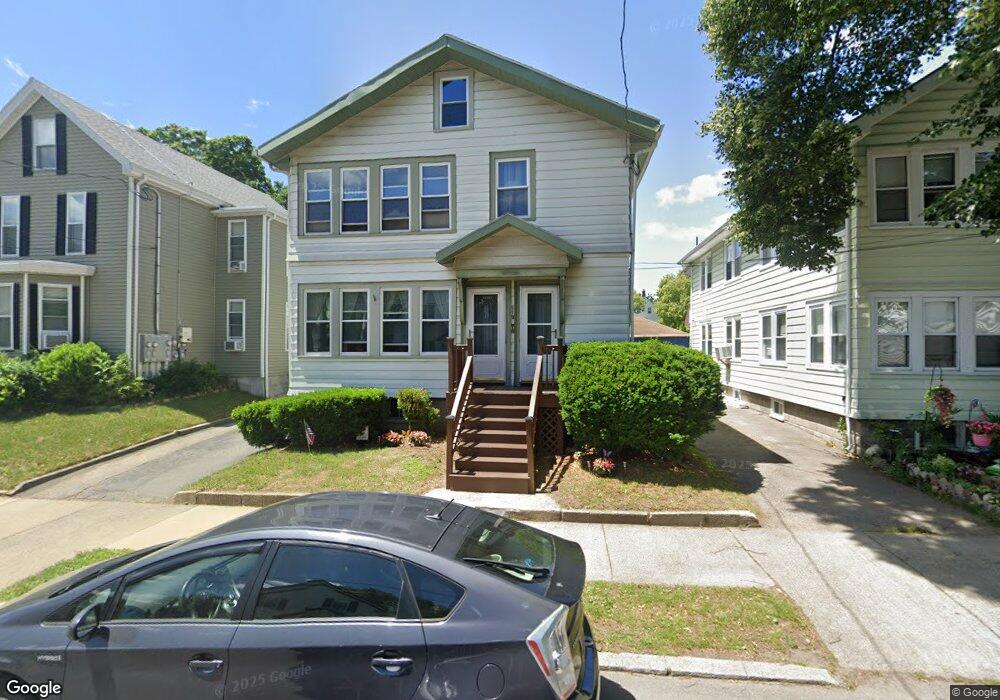
117 Bowler St Lynn, MA 01904
Agganis AC NeighborhoodEstimated Value: $683,709 - $941,000
About This Home
This home is located at 117 Bowler St, Lynn, MA 01904 and is currently estimated at $803,427, approximately $330 per square foot. 117 Bowler St is a home located in Essex County with nearby schools including Edward A. Sisson Elementary School, William R. Fallon School, and Fecteau-Leary Junior/Senior High School.
Ownership History
We collect this data history from publicly available records. To have your information removed, we recommend requesting removal directly through your county’s website.
Purchase Details
Purchase Details
Home Financials for this Owner
Home Financials are based on the most recent Mortgage that was taken out on this home.Home Values in the Area
Average Home Value in this Area
Purchase History
We collect this data history from publicly available records. To have your information removed, we recommend requesting removal directly through your county’s website.
| Date | Buyer | Sale Price | Title Company |
|---|---|---|---|
| -- | None Available | ||
| $225,150 | -- | ||
| $225,150 | -- |
Mortgage History
We collect this data history from publicly available records. To have your information removed, we recommend requesting removal directly through your county’s website.
| Date | Status | Borrower | Loan Amount |
|---|---|---|---|
| Previous Owner | $223,193 |
Tax History
We collect this data history from publicly available records. To have your information removed, we recommend requesting removal directly through your county’s website.
| Year | Tax Paid | Tax Assessment Tax Assessment Total Assessment is a certain percentage of the fair market value that is determined by local assessors to be the total taxable value of land and additions on the property. | Land | Improvement |
|---|---|---|---|---|
| 2025 | $7,305 | $705,131 | $187,600 | $517,531 |
| 2024 | $6,976 | $662,500 | $183,400 | $479,100 |
| 2023 | $6,893 | $618,200 | $172,400 | $445,800 |
| 2022 | $6,823 | $548,900 | $135,500 | $413,400 |
| 2021 | $6,591 | $505,800 | $137,200 | $368,600 |
| 2020 | $6,057 | $452,000 | $123,700 | $328,300 |
| 2019 | $5,883 | $411,400 | $116,500 | $294,900 |
| 2018 | $5,416 | $357,500 | $108,400 | $249,100 |
| 2017 | $5,139 | $329,400 | $95,700 | $233,700 |
| 2016 | $4,778 | $295,300 | $88,500 | $206,800 |
| 2015 | $4,655 | $277,900 | $94,000 | $183,900 |
Map
- 10 Pond St
- 2 Chestnut Terrace
- 30 Linden Terrace
- 40 Carter Rd
- 28 Hawthorne St
- 21 Dennison Ave
- 57 Allen Ave
- 5 Morrill Place
- 50-52 Allen Ave
- 200 Locust St Unit 303
- 198 Locust St Unit 1-702
- 198 Locust St Unit 105
- 154-156 Tracy Ave
- 19 Boynton St
- 135 Allen Ave
- 394 Western Ave
- 10 Lake View Place
- 406 Broadway Unit 307
- 406 Broadway Unit 301
- 199 Allen Ave
Ask me questions while you tour the home.