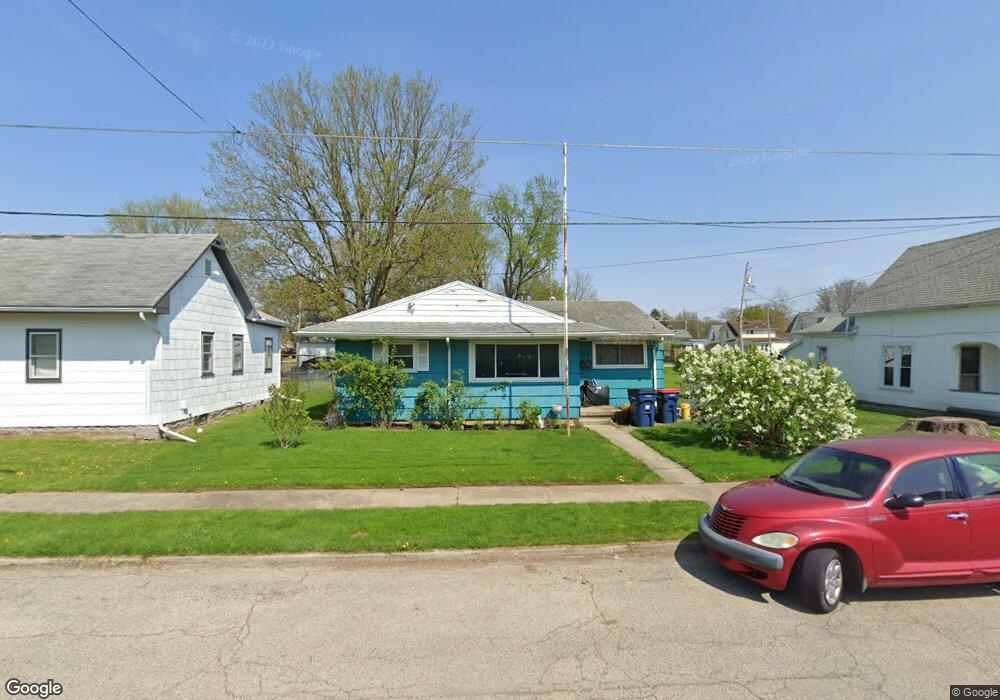
117 Morrow St Piqua, OH 45356
Piqua AreaEstimated Value: $121,000 - $141,000
About This Home
This home is located at 117 Morrow St, Piqua, OH 45356 and is currently estimated at $132,397, approximately $125 per square foot. 117 Morrow St is a home located in Miami County with nearby schools including Piqua Junior High School, Piqua High School, and Nicholas School.
Ownership History
We collect this data history from publicly available records. To have your information removed, we recommend requesting removal directly through your county’s website.
Purchase Details
Purchase Details
Home Values in the Area
Average Home Value in this Area
Purchase History
We collect this data history from publicly available records. To have your information removed, we recommend requesting removal directly through your county’s website.
| Date | Buyer | Sale Price | Title Company |
|---|---|---|---|
| $100,000 | Attorney | ||
| $48,056 | -- |
Mortgage History
We collect this data history from publicly available records. To have your information removed, we recommend requesting removal directly through your county’s website.
| Date | Status | Borrower | Loan Amount |
|---|---|---|---|
| Previous Owner | $56,408 | ||
| Previous Owner | $25,000 |
Tax History
We collect this data history from publicly available records. To have your information removed, we recommend requesting removal directly through your county’s website.
| Year | Tax Paid | Tax Assessment Tax Assessment Total Assessment is a certain percentage of the fair market value that is determined by local assessors to be the total taxable value of land and additions on the property. | Land | Improvement |
|---|---|---|---|---|
| 2025 | $1,281 | $34,550 | $5,950 | $28,600 |
| 2024 | $1,220 | $25,970 | $6,650 | $19,320 |
| 2023 | $1,067 | $25,970 | $6,650 | $19,320 |
| 2022 | $1,114 | $25,970 | $6,650 | $19,320 |
| 2021 | $885 | $19,260 | $4,940 | $14,320 |
| 2020 | $885 | $19,260 | $4,940 | $14,320 |
| 2019 | $890 | $19,260 | $4,940 | $14,320 |
| 2018 | $910 | $18,770 | $4,940 | $13,830 |
| 2017 | $921 | $18,770 | $4,940 | $13,830 |
| 2016 | $912 | $18,770 | $4,940 | $13,830 |
| 2015 | $898 | $18,060 | $4,760 | $13,300 |
| 2014 | $898 | $18,060 | $4,760 | $13,300 |
| 2013 | $901 | $18,060 | $4,760 | $13,300 |
Map
- 1014 Covington Ave
- 1118 Covington Ave
- 409 Wilson Ave
- 314 Mckinley Ave
- 1416 Plum St
- 364 Ellerman St
- 219 Gordon St
- 219 Gordon St
- 634 Covington Ave
- 000 High St
- 724 South St
- 809 W Water St
- 1510 Garfield St
- 530 Cottage Ave
- 519 Miami St
- 1435 Covington Ave
- 512 Harney St
- 440 Miami St
- 1224 Marwood Dr
- 500 Beverly Dr
- 121 Morrow St
- 115 Morrow St
- 125 Morrow St
- 1025 Covington Ave
- 127 Morrow St
- 1027 Covington Ave
- 1023 Covington Ave
- 126 Linden Ave
- 128 Linden Ave
- 1103 Covington Ave
- 124 Linden Ave
- 130 Linden Ave
- 124 Morrow St
- 1015 Covington Ave
- 126 Morrow St
- 131 Morrow St
- 132 Linden Ave
- 130 Morrow St
- 1105 Covington Ave
- 1013 Covington Ave
Ask me questions while you tour the home.